

Watch tutorials, webinars and informative videos about PreSens optical sensor systems.
Assessment of Oxygen Depletion and Biofilm Structure Grown in MBBR Carriers
Tracking the Distribution of Oxygen Penetration through Biofilm Carriers with VisiSens
E. Gilbert, S. Lackner, M. Wagner, and H. Horn
Chair of Water Chemistry and Water Technology, Engler-Bunte-Institut, Karlsruhe Institute of Technology, Germany
Biofilm systems like moving bed biofilm reactors (MBBR) are used for wastewater treatment. Preliminary tests were conducted to evaluate the suitability of 2D oxygen imaging for monitoring oxygen distribution and penetration through BioChip M carriers cultivated with biofilm. The VisiSens system provided oxygen maps of the carriers set up in a simple flow cell with high spatial resolution. The 2D images recorded over time allowed to correlate metabolic activity of the biofilm with the overall structure of the biofilm cultivated on BioChip M in a MBBR. Compared to time consuming and expensive measurements with microelectrodes VisiSens can provide more detailed information when investigating the impact of biofilm structure on mass transport and transfer processes.
Biofilm systems have been widely used in wastewater treatment since the early 1900. New and more complex technologies have emerged, one example being the moving bed biofilm reactor (MBBR). In such a system biofilm grows on suspended plastic carriers which allow a much higher biomass density compared to conventional activated sludge systems. These systems are often employed for industrial wastewater treatment with high organic loading, or for nitrogen removal. The high biomass density leads to high volumetric conversion rates with ideally no substrate limitation for the biofilm. To ensure sufficient substrate transport to the biofilm on the protected surface area laminar flow over the biofilm is required which is provided by the mixing pattern in the MBBR. Being able to monitor dissolve oxygen (DO) on the carrier is highly interesting to evaluate both, biofilm and carrier material. As the carriers inside an MBBR dominantly face the flow parallel to the circular cross-section, the distribution of oxygen through the biofilm grown on the carrier is heterogeneous. Up to now, characterization of biofilms in terms of oxygen depletion was only feasible with microelectrodes, which involved very time-consuming measurements. Characterization of heterogeneous oxygen distribution over the carrier or during different phases of reactor operation was not possible with this method. The use of the VisiSens sensor foils (SF-RPSU4, PreSens) for two-dimensional monitoring of oxygen concentrations over time is therefore a great improvement for the characterization of substrate transport in biofilms. This report describes a preliminary test for monitoring oxygen distribution and penetration through biofilm carriers in a simple flow cell with the VisiSens system. The sensor foil was placed on the side of the carrier that did not face the flow in order to detect only the oxygen which was transported all the way through the carrier.
Materials & Methods
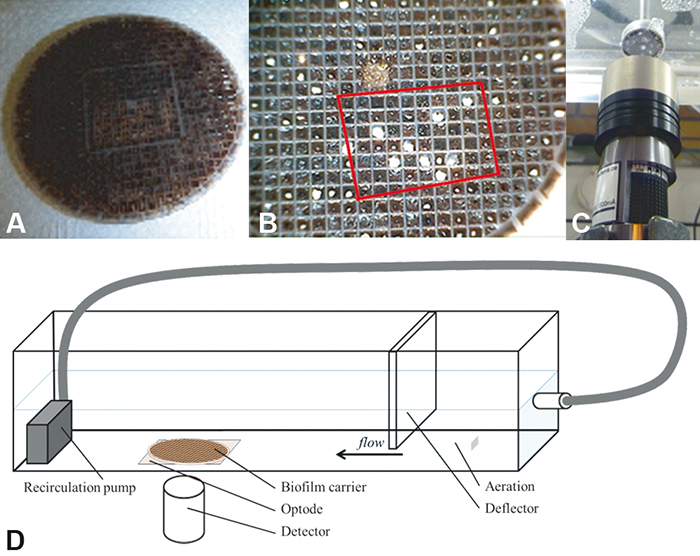
The experiments have been conducted with biofilm carrier type BioChip M (AnoxKaldnes, Sweden). This biofilm carrier is an even flat cylinder (d = 50 mm, h = 1 mm) with an even 1.7 mm x 1.7 mm grid (see Fig. 1). Experiments were conducted in a flow cell (l = 600 mm, h = 68 mm, w = 60 mm) made from plexiglas (see Fig. 1 D). The VisiSens sensor foil was glued to the bottom plate of the flow cell with silicon glue. On top of the foil a biofilm carrier was fixed to the bottom plate with adhesive tape. A pump placed behind the carrier (outlet) pumped the water to the inlet of the flow cell. Thus, a constant recirculation was achieved. To ensure even distribution of the water flow, a deflector plate was placed between water inlet and biofilm carrier. An aeration stone for fine bubble aeration was placed ahead of the deflector plate. Calibration of the sensor foil was performed at 0 % and 100 % saturation of oxygen in water at 20 °C. After aerating the bulk phase in the flow cell to oxygen saturation, the aeration was switched off and oxygen measurement was started. Pictures were taken every 10 seconds for a period of 200 measurements. Image analysis was performed using ImageJ (National Institute of Health, v1.47b, Bethesda, USA) after converting RAW to IMJ files with the latest version of the converter software provided by PreSens. After converting R-values into percent oxygen saturation, negative values were set to NaN. Thus, they are ignored in further calculations. Further data analysis and plotting were performed with R (R Core Team, R Foundation for Statistical Computing, Vienna, AT).
Oxygen Distribution on BioChip M
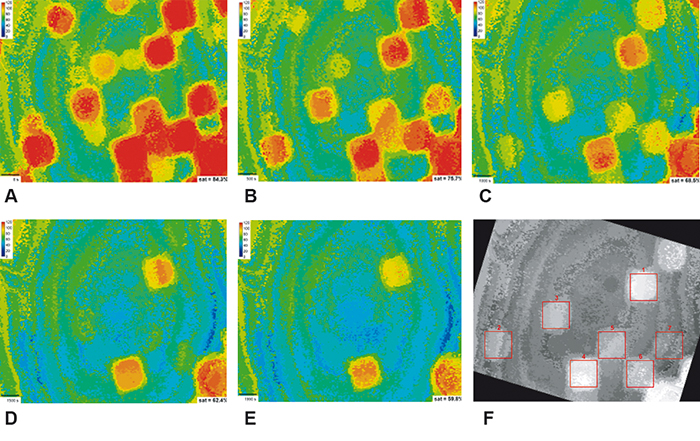
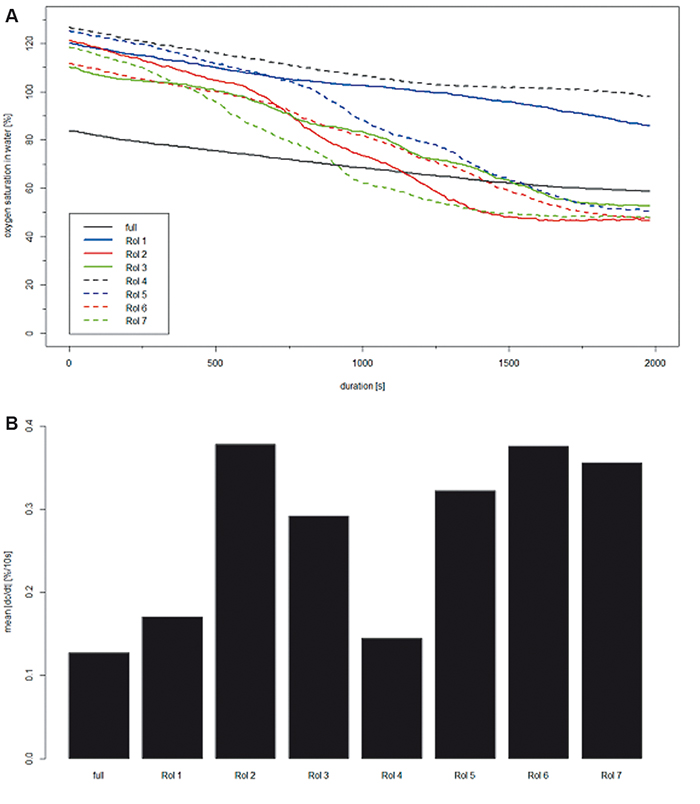
Figure 2 (A - E) illustrates the heterogeneous oxygen distribution throughout the BioChip M. Flow velocity was kept constant and even though there were grids containing less biofilm than others (see Fig. 1 B) no air bubbles were trapped. In total mean saturation decreased from 84.3 % (Fig. 2 A) to 59.8 % (Fig. 2 E) within 2000 s. Of special interest were the `hot spots´, where oxygen was decreasing slowly. They corresponded to some extend to the regions of less biofilm. Seven of these `hot spots´ were investigated in more detail. Time series images were accumulated in a stack and rotated to the right so the `hot spots´ aligned with the grid and a square selection was used to define regions of interest (ROI). These ROIs were subsequently processed (Fig. 2 F). DO in % was calculated for each single oxygen image within the complete stack for each ROI. Thereby, the DO change over time as well as the depletion rate dc/dt were derived. Results are shown in Fig. 3. Values at Δt = 0 s, 500 s, 1000 s, and 2000 s are identical to the ones shown in Fig. 2. However, after 600 s oxygen depletion started to be locally different. ROI 2, 3, 5, 6, and 7 showed a significantly higher decrease in oxygen saturation whereas ROI 1 and 4 followed more or less the trend of the complete BioChip M. As the experimental conditions were constant during the experiment measured variations in the oxygen depletion can only be addressed to the biofilm cultivated on the BioChip M. Generally, grids of low biomass content and thus low oxygen demand (aerobic respiration, metabolic activity) are identified as regions of high DO saturation at the end of the experiment. The average oxygen depletion rate dc/dt was calculated in R and results plotted in Fig. 3 B. In agreement with previously shown results, the oxygen depletion rates are almost twice as high for filled grids (dc/dt approx. 0.35 %/10 s, ROI 2, 5 - 7) compared to less filled grids (dc/dt approx. 0.15 %/10 s, ROI 1 and 4).
Conclusion
The VisiSens system provides information about the oxygen distribution within BioChip M carriers cultivated with biofilm non-invasively and with high spatial resolution. Furthermore, regions of interest can be analyzed to derive information about the biomass activity in more detail at specific locations (`hot spots´). Although information about the oxygen saturation over depth are not available, oxygen depletion rates are easy to calculate and thus definitely an advantage compared to measurements with microelectrode Based on image processing, the metabolic activity of the biofilm can be correlated to overall structure of the biofilm cultivated on BioChip M in a MBBR helping us to further understand the impact of biofilm structure on mass transport and transfer processes.