

Watch tutorials, webinars and informative videos about PreSens optical sensor systems.
Spatio-temporal O2 Gradients in the Microenvironment of an Outgrowing Cell Patch
Oxygen Imaging in Micro-Scale with the VisiSens TD MIC System
C. Schmittlein1, R. J. Meier2, J. Wegener1,3
1Institute of Analytical Chemistry, Chemo- and Biosensors, University of Regensburg, Regensburg, Germany
2PreSens Precision Sensing GmbH, Regensburg, Germany
3Fraunhofer Research Institution for Microsystems and Solid State Technologies (EMFT), Regensburg, Germany
Cell-based assays have emerged to an indispensable tool in all areas of the biomedical sciences. However, cell culture experiments in a laboratory environment are always questioned for their physiological relevance in general and their compliance with the physiological microenvironment in particular. Oxygenation for example is not routinely controlled in 2D cell culture experiments, although hypoxia, i.e. O2 values lower than air saturation, is common to many types of tissue in the animal body. Most cell culture is performed, however, under 'standard conditions' (95 % air, 5 % CO2, 37 ºC) so that oxygen levels in the cell culture fluid are non physiological. Static cell cultures build up a cell-type dependent microenvironment, which is the result of cellular respiration, proliferation and the finite diffusion rates in static media. It was the aim of this study to measure the local O2 concentration in the microenvironment of adherent cell patches that are allowed to proliferate and migrate. Local oxygen levels were measured using the 2D O2 imaging system VisiSens TD MIC, that fits inside a standard 48 L incubator and allows monitoring adherent cells under variable culture conditions. The core component of the measurement are O2 sensor foils (SF-RPSu4, PreSens), that were used as culture substrates for the adherent cells under study. The close proximity of cells and optical sensor layer enables measurements of pO2 levels in the microenvironment underneath the adherent cell layer. The VisiSens TD MIC system was used to non-invasively measure temporal and spatial changes of O2 gradients caused by actively respiring and migrating patches of adherent cells.
Material & Methods
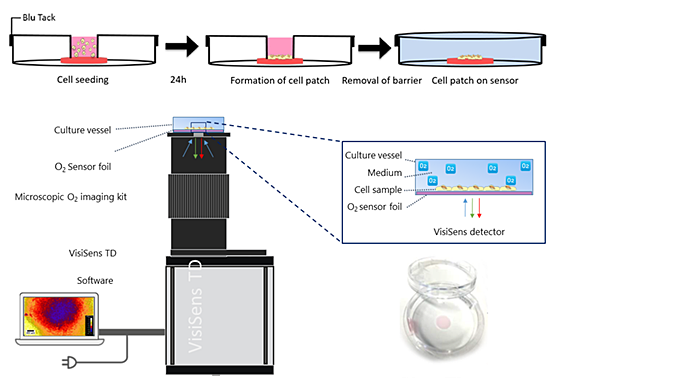
O2 levels in the cellular microenvironment were quantified and visualized using the VisiSens TD imaging system equipped with microscope optics and a matching light source for small scale analyte mapping. The system provides a 2x magnification. A round piece of the O2 sensitive planar sensor foil (SF-RPSu4) with 0.7 cm diameter was glued onto the bottom of a standard Petri dish with a diameter of 3.5 cm using a biocompatible silicone adhesive. The glue was allowed to dry for at least 24 h before experiments were conducted. The optical isolation layer was removed from the sensor foil. Before cells were seeded, the Petri dishes containing the sensor foils were exposed to argon plasma for 1 min to clean and sterilize the surface (see Fig. 1). To create a small cell patch smaller than the sensor foil, suspended cells were seeded in a small insert. It served as physical barrier and thus prevented cells from spreading upon the whole sensor surface. The Petri dish was covered with a lid containing a small inlet for cell seeding. The rim of the lid was coated with a thin layer of Blu-Tack® and pressed firmly to the lower part on the bottom of the Petri dish. The mechanical load of the lid pressed down the barrier insert so that no cell suspension could leak out. 100 µL of cell suspension (2.0 x 10⁵ cell cm-2, growth area = 3.2 mm2) were added to the inner compartment of the insert. Cells were incubated for 24 h at 37 ºC, 95 % air and 5 % CO2. Then, lid and insert were removed and the sample was washed twice with 1 mL L-15 medium. The Petri dish was filled with 9.6 mL L-15 medium and got sealed airtight using a new lid without any opening. Two-point calibration of the O2 sensor was accomplished by applying cell culture media with 0 % (v/v) O2 (medium supplemented with 10 g/L Na2SO3 reducing all dissolved oxygen) and ambient air saturated medium. Calibration values were transformed from % air saturation to torr using the PreSens Oxygen Calculator. Automated time-series recordings and evaluation of the O2 images was done in the VisiSens ScientifiCal 1 software.
Results
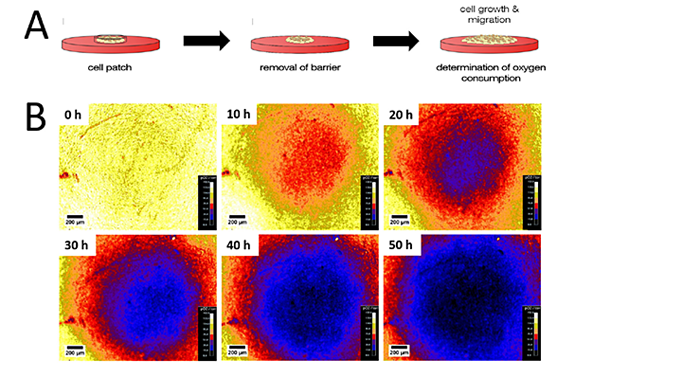
Adherent cells forming a patch in the center of the sensor foil were allowed to freely migrate and spread after the spatial barrier was removed. O2 imaging started at the same time and the temporal and spatial changes of O2 during migration were monitored (Fig. 2A). Figure 2B depicts typical data from one individual cell patch as a function of time for an observation period of 50 h. Four independent patches were investigated yielding similar results. The pseudo-color O2 images in Figure 2B show the formation of an O2 gradient with lower O2 concentrations in the center of the patch caused by cellular respiration. Cells in the center are surrounded by other respiring cells so that there is no radial influx of oxygen. Cells in the periphery are surrounded by medium so that the consumed oxygen is additionally replenished by lateral diffusion from the periphery and not only by oxygen diffusion from liquid layers above the cells. After 10 h, the mild hypoxia caused by the actively respiring cell patch is clearly visible. Within the next 10 h, the O2 gradient between cells and the peripheral medium further increased in steepness, resulting in a hypoxic central patch region. The size of the hypoxic area increased along the measurement, as the cell patch expanded due to cell migration and proliferation.
The time course of the O2 decrease in a given ROI (region of interest) is dependent on its position relative to the area covered by the cell layer. Figure 3A shows three selected ROIs (each 85 x 80 px), from different position of the initial cell patch (ROI 1: center of cell patch, ROI 2: fringe area of cell patch) or at the initially cell-free O2 sensor area (ROI 3). pO2 values of the initially cell-covered area are easily distinguished from values determined for the initially cell-free sensor surface. The pO2 levels at t = 0 h range from anoxic values of (142 ± 10) torr for ROI 3, to slightly lower pO2 levels of (119 ± 9) torr for ROI 1 and (121 ± 10) torr for ROI 2. Due to cellular O2 consumption, the O2 levels in the center of the cell patch (ROI 1) decreased by about 90 % to (14 ± 4) torr within 40 h, reaching (1 ± 3) torr after 69 h of imaging. At the edge of the MDCK II patch (ROI 2), the O2 values dropped by about 65 % to a value of (44 ± 6) torr after 40 h of imaging and finally reached pO2 levels of (7 ± 4) torr. This result is similar to ROI 1, which indicates that cells had grown and migrated over the sensor surface during the measurement so that ROI 2 is no longer in the fringe region of the patch but central. This trend is also apparent for the initially cell-free sensor site (ROI 3). O2 does not remain at initial normoxic values and starts to decrease fast after approx. 15 h, first due to a diffusion depletion in the medium and subsequently due to coverage by respiring cells and their microenvironment. O2 levels were quanitfied to (77 ± 10) torr at t = 40 h and further dropped to (25 ± 6) torr after 69 h of imaging.
Since the cells on the opaque sensor foil are not directly accessible by phase contrast microscopy, MDCK II growth and migration was documented by staining the cells with carbol fuchsin. The stained specimen was analyzed by stereomicroscopy. Figure 2 B shows the stained cells immediately after barrier removal at t = 0 h and after 40 h of imaging. The initial size of the spot was about 3.3 mm2 and increased about 8-fold to 27.3 mm2 at t = 40 h. The cells spread on both O2 sensor foil and Petri dish along the experimental observation time of 40 h.

Discussion & Conclusion
The VisiSens TD MIC system allows imaging the temporal and spatial changes in O2 consumption of adherent cell monolayers quantitatively and in real time. Our study shows, that O2 levels are determined in the direct microenvironment underneath the cells, that are growing on the sensor foil. Since (I) the distance between plasma membrane and sensor foil is tin the order of 100 nm and (II) the plasma membrane is highly permeable to molecular oxygen, oxygen levels reported by the sensor mirror the oxygen levels in the cytoplasm. Strong spatial and temporal changes of oxygen levels are observed at different spots of the growing cell monolayer indicating that the cells within one outgrowing cell layer experience very different metabolic situations (aerobic vs anaerobic) dependent on their position in the cell layer. This locally different oxygen levels may be one source of heterogeneity that is frequently observed within cell populations that were nominally cultured under exactly the same culture conditions. The VisiSens TD MIC systems allows evaluating local differences in metabolic performance and all consequences derived therefrom.