
Watch tutorials, webinars and informative videos about PreSens optical sensor systems.

2D Visualization of CO2 Distributions
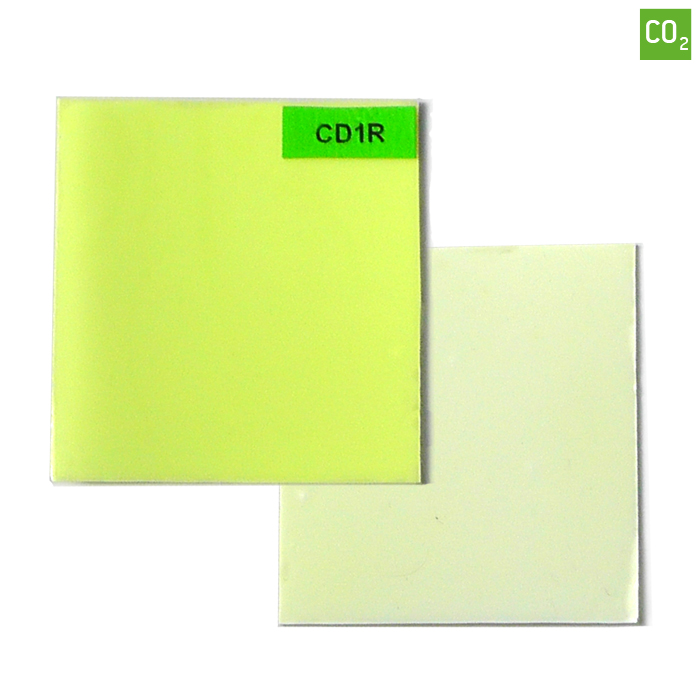
CO2 Sensor Foil SF-CD1R
This chemical optical CO2 sensor foil can be attached to any sample surface or to the inner surface of any transparent glass or plastic vessel. CO2 distributions over whole surface areas are then visualized contactless and non-destructively with the VisiSens™ detector unit DU03 or VisiSens TD. The SF-CD1R is used for measurements in liquids or samples with a constant relative humidity of 100 %, and has a measuring range of 1 – 25 % CO2.
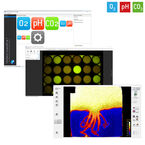
- 2D read-out
- Contactless, direct sensing or through transparent walls
- Visualize spatial and temporal gradients
- Numerous measurement points in one image
Applications

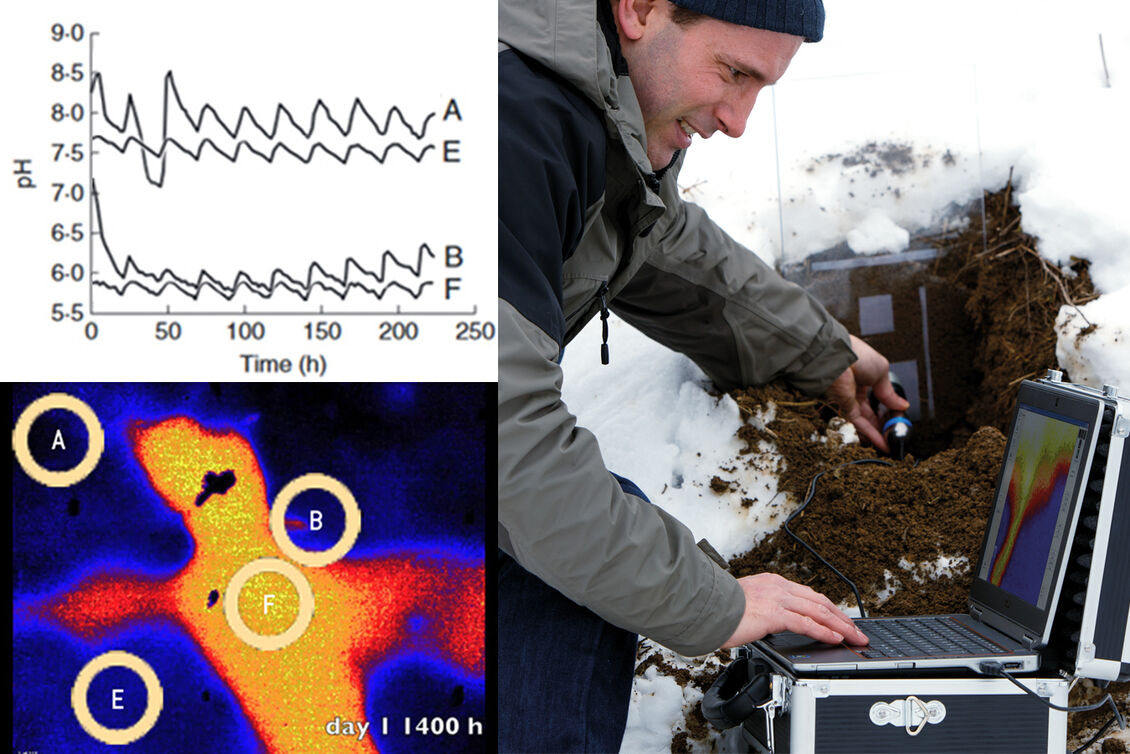
O2, pH and CO2 Mapping in Sediments
O2, pH, and CO2 are key factors for microbial activity and various geochemical processes in sediments. They highly vary locally, e.g. at interfaces or different depths. Spatial and temporal analyte dynamics over long time periods can be visualized. Various regions can be compared within one measurement. VisiSens enables non-invasive 2D-mapping over cross-sections or on sample surfaces. The portable device can be used in lab and field.
Spatial and Temporal Analyte Changes in Plants & Soil
O2, pH and CO2 play a crucial role in plant and soil processes, e. g. in photosynthesis, respiration, in rhizospheres or in microbiological processes. Metabolic processes can be monitored. This planar optical sensor technique allows non-invasive read-out through glass walls of rhizotrons. Studying metabolic activity of roots and determining the cultivation optimum is important for sustainable agriculture, e. g. for adjustment of water and fertilizer supply.
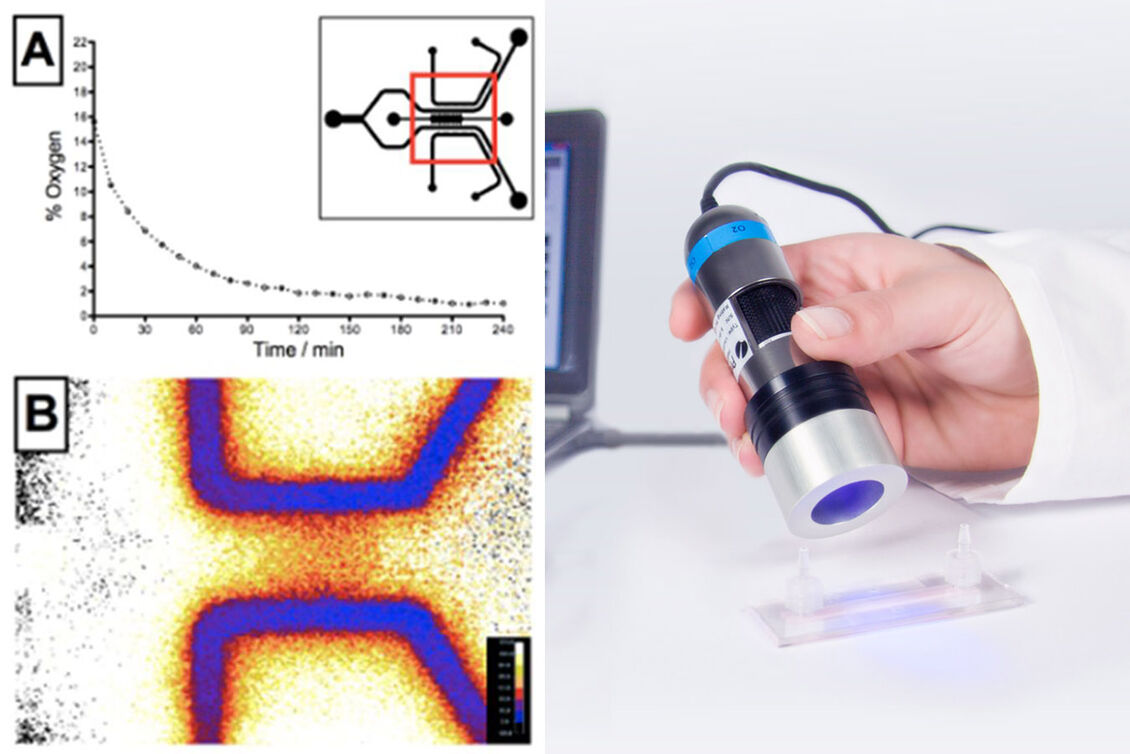
Non-invasive 2D Analyte Mapping in Microfluidics
VisiSens™ enables 2D visualization of important culture parameters inside microfluidic chips. You can continuously monitor in 2D, with high resolution at specific positions or over the whole chip surface in a non-contact readout mode. Detect metabolic hotspots, record time-series, and monitor hypoxia, cellular growth, or O2 supply inside the chip. You can gain new insights on metabolic activity and natural or artificially produced gradients.
Technical
| Specifications# | |
|---|---|
| # VisiSens™ is no approved medical device * typical data which may stronlgy differ with adapting the imaging set-up to specific needs ** typical data of precision of a defined ROI (> 6,000 pixels) over time at 20 °C, excluded ambient light, FoV 8 cm x 6 cm, DU03 strongly differs *** typical data of spatial standard deviation in defined ROI > 6,000 pixels at 20 °C, excluded ambient light, FoV 8 cm x 6 cm, DU03 strongly differs | |
| Measurement range | 0 - 25 % pCO2 at atmospheric pressure (1013.15 hPa) |
| Response time (t90)* | < 3 min. |
| Specifications using VisiSens TD read-out | |
| Precision (temporal)** | ± 0.02 % CO2 at 2.0 % CO2 ± 0.01 % CO2 at 25.0 % CO2 |
| Precision (spatial)*** | ± 0.2 % CO2 at 2.0 % CO2 ± 1.2 % CO2 at 25.0 % CO2 |
| Properties | |
| Compatibility | Aqueous solutions, pH 4 - 9 |
| General sensor temperature working range | from +5 to + 45 °C |
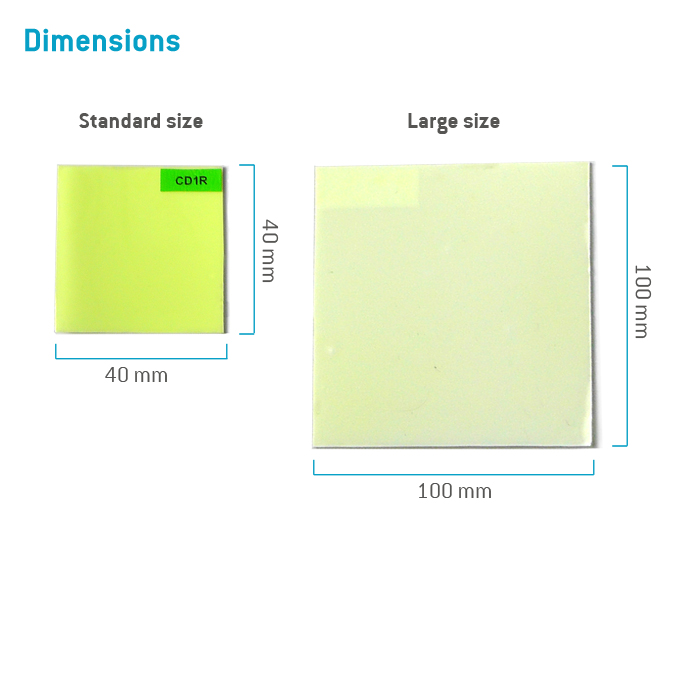
| Size of sensor foil | Standard 40 x 40 mm2 min. 5 x 5 mm2 |
Related products
Resources
Publications
Immobilized Plant Cells - From DSMZ to the Customer
Exchange of O2 and CO2 in the Capillary Fringe of a Porous Medium
Biogenic Gas Bubbles Produced within Soil Macropores
O2, CO2 and pH Dynamics in the Capillary Fringe
Imaging Rhizosphere pH and CO2 Dynamics
Iron Lung: How Rice Roots Induce Iron Redox Changes in the Rhizosphere and Create Niches for Microaerophilic Fe(II)-Oxidizing Bacteria
Dynamics of oxygen and carbon dioxide in rhizospheres of Lobelia dortmanna - a planar optode study of belowground gas exchange between plants and sediment
Plant-Sediment Interactions in Salt Marshes - An Optode Imaging Study of O2, pH, and CO2 Gradients in the Rhizosphere
Luminescence Lifetime Imaging of Oxygen, pH, and Carbon Dioxide Distribution Using Optical Sensors
Quantitative imaging of rhizosphere pH and CO2 dynamics with planar optodes
Online Monitoring of Crude Oil Biodegradation at Elevated Pressures
Ultrasonic welding of chemical optical sensors supporting O2, pH and CO2 imaging in microfluidic systems
FAQs
Can I use the SG-1 silicone glue for the VisiSens CO2 sensor foils also?
Can the VisiSens CO2 sensor foils also be used in the gas phase?
Do I measure CO2 or HCO3-?
How do I calibrate a CO2 Sensor Foil SF-CD1R?
My live image representation in the VisiSens software is very slow, and I dont´t get a smooth reproduction. What can I do?
The standard size of the VisiSens sensor foils is rectangle 4 x 4 cm. What can I do, if my sample requires a different size or shape?
There are "jumps" in my VisiSens time series. What can I do?
What is the minimum sensor size for VisiSens?
What is the time of delivery?
Which side of the VisiSens sensor foils has to face the sample?
Which substances can interfere with the optical O2, pH and CO2 measurements?
Manuals
CO2 Sensor Foils SF-CD1R & SF-CD2R
Detector Units DU01 / DU02 / DU03
VisiSens AnalytiCal 3
Media
Video: How2 Measure and Visualize O2, pH & CO2 Distributions in 2D for Biological Research
Video: How2 Measure and Visualize O2, pH & CO2 Distributions in 2D for Life Science Research
Video: VisiSens Delivered Equipment
Video: VisiSens WEBINAR - O2, pH & CO2 in Sediments, Interfaces and Biofilms
Video: VisiSens WEBINAR - O2, pH & CO2 in Plants, Roots and Soil