

Watch tutorials, webinars and informative videos about PreSens optical sensor systems.
What exactly does the VisiSens software function Live Profiles do and what information can I get from it?
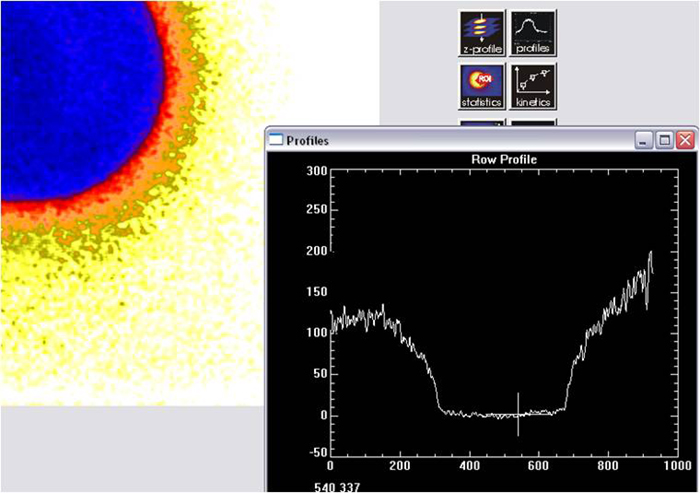
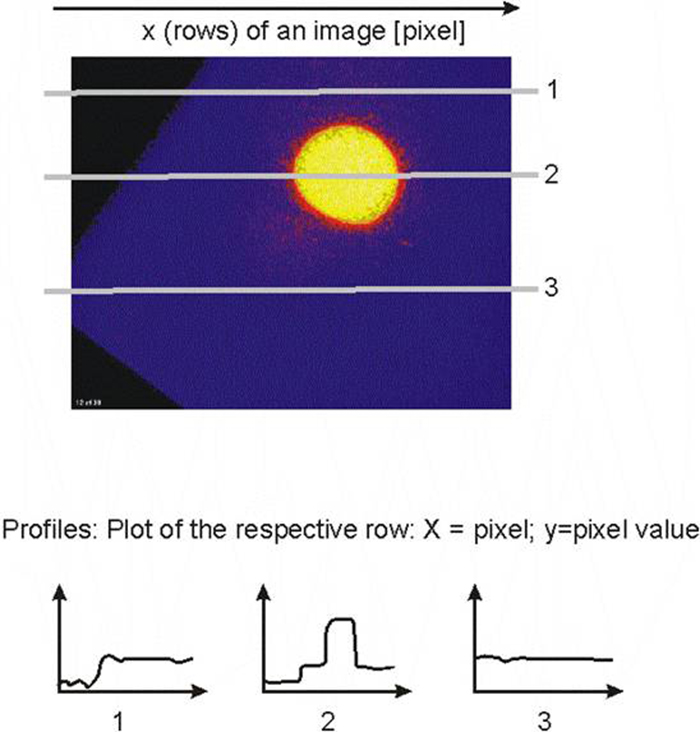
Live Profiles displays a two-dimensional graph of the values of pixels along a line within the image. More correctly, it displays a x-/y-graph of the respective row of the current image. This can be the sensor raw response (R-value) image or the % air saturation values (after applying calibration). The respective row shown in the graph is the row the user points to with the cursor.
The x-axis shows the pixel of the respective row while the y-axis gives the respective pixel value.
Live Profiles gives very fast and interactive information about a) oxygen distribution (pseudo color representation of the image) and b) order of magnitude of gradients (profile plot).