

Watch tutorials, webinars and informative videos about PreSens optical sensor systems.
Measuring Leaf O2 Consumption Rates with the SDR® SensorDish Reader
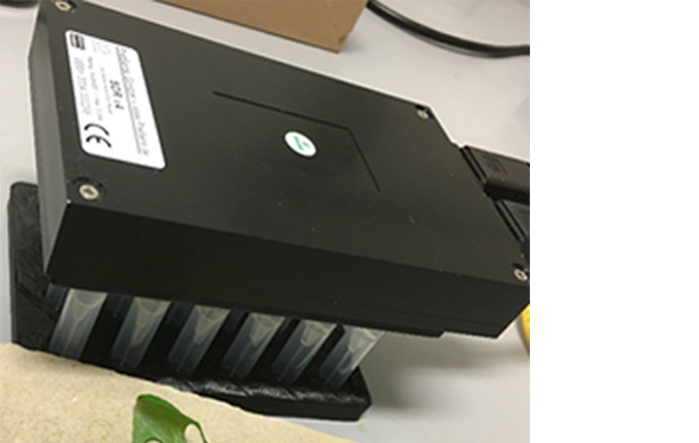
Adapted SDR Set-Up with Tubes and O2 Sensor Spots in Screw Caps
Brendan O'Leary
ARC Centre for Plant Energy Biology, The University of Western Australia, Perth, Australia
I tested whether the influence of external metabolites on leaf O2 consumption rates could be measured with the SDR. Specifically, it was previously observed in a screen of metabolite effects on leaf O2 consumption rate (using Q2 by Astec Global) that 10 mM proline (Pro) causes an approximately two-fold stimulation of respiration rate over 14 hours. The key aspects of this measurement are its duration (> 14 h) and its dynamic nature, as we are interested in how rates change over time. I adapted the SDR set-up, so oxygen in the headspace of tubes containing the samples could be measured.
Background: Need for plant respiration measurements
Respiratory flux and photosynthetic rate are the only metabolic flux measurements routinely applicable in plants, and both are therefore crucial tools to understand plant biochemistry and physiology. Several technologies currently exist which can measure plant respiratory gas exchange rates such as infra-red gas analyzers for CO2 and Clark-type O2 electrodes for oxygen. Both technologies suffer from being low-throughput and short duration measurements techniques, which hinders large scale experimental designs that would be of use to plant breeders for example. The Australia Research Council Centre of Excellence in Plant Energy Biology (PEB) has been at the forefront of developing and trialling new respiration measurement technologies for use in plants. Specifically, the use of O2-dependent fluorescent quenching has been adopted into several high-throughput technologies such as the SDR SensorDish® Reader, the Seahorse or the Q2 by Astec Global. However, use of these technologies within plant science is rare and the Seahorse in particular is limited in its applications using plant tissues that float [1]. Although we have tried standard SDRs combined with previously available glass plates with sensor spots, the location of the spots at the bottom of wells was not compatible with measurements involving liquids and a headspace. Much respiration research at PEB currently relies on the Q2. This machine essentially uses their own version of sensor spots placed in the caps of screw top tubes and a robotic sensor arm. The Q2 works well overall with various plant tissues and is a great improvement in measurement capacity, as evaluated in Scafaro et al., 2017 [2]. The simple tube and cap set-up is also amenable to measurements with liquid media; this is a large advantage because it allows the introduction of chemicals into the respiration assays greatly expanding their usefulness [3]. Therefore, I wanted to test whether the SDR could be adapted to a similar set-up as the Q2, with tubes and sensor spot caps, and whether it would possess superior measurement properties.
Materials & Methods
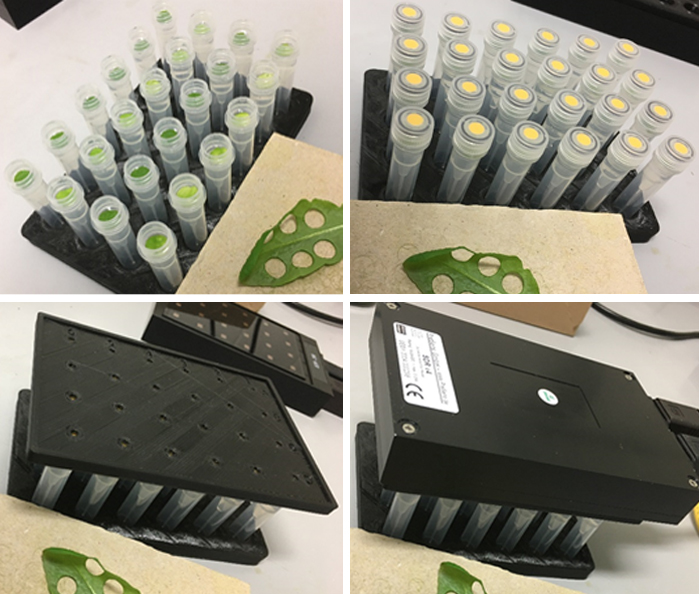
The experimental set-up was simple and rapid (Fig. 1). Plastic screw cap tubes with a total capacity when capped of 856 µL were filled with 600 µL of buffered solution (50 mM HEPES, 10 mM MES, 200 µM CaCl2, pH 6.6) in the presence or absence of 10 mM Pro (or any other chemical as desired) leaving a 256 µL headspace of air. Seven mm leaf discs were punched and floated on the solutions and tubes capped (n = 10). Blank tubes without leaf discs for each treatment should be included in all assays as they are necessary to remove substantial background noise and increase data quality. The SDR is then assembled using two 3D printed adapters (PreSens). The set-up takes approximately 15 min for one SDR. The caps and tubes provided were of high quality. The assembly of the unit was quite robust considering the minimal design of the adapters. Oxygen data was collected in the dark at room temperature. The assay proceeded overnight (~ 17 h) using 15 s intervals. Data was exported to Excel for analysis. The whole experiment was repeated 3 times and the same results were achieved each time.
Results
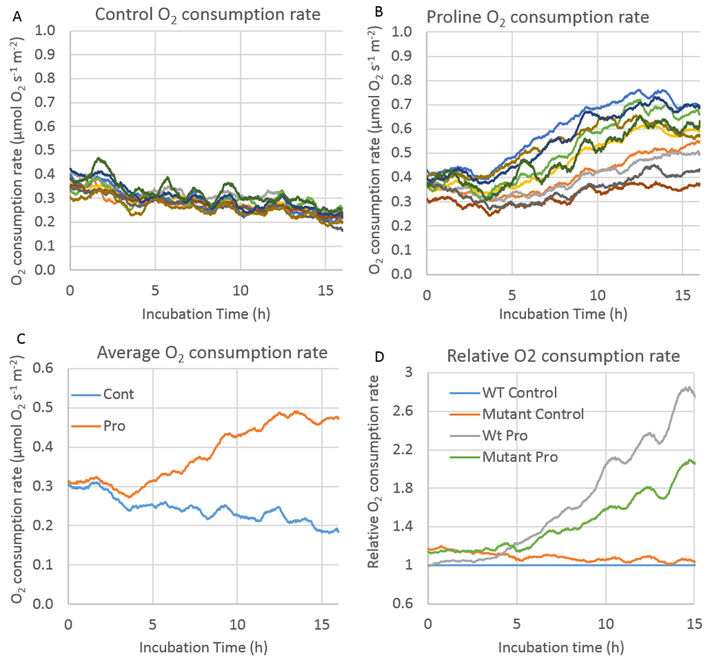
Figure 2 shows oxygen measurements from one experiment comparing untreated vs Pro treated leaf discs recorded with the SDR. These values were used for further consumption rate calculations. I corrected O2 consumption rate over time by subtracting the average rates in blank tubes without leaf discs. Rates were then calculated as moving 1.5 h window (Fig. 3A - B). The smoothness of the O2 consumption rate traces over time is a function of the time window used to calculate the moving slope: bigger window equals smoother trace. However, for the purposes of this experiment the noise remaining following blank subtraction is a non-factor. O2 percentages were converted to molar values according to Scafaro et al. 2017 [2].

The results show that the SDR plate in conjunction with the tubes and caps set-up reproduce the previous results obtained with the Q2. O2 consumption rate declined gradually over time in control leaf discs (Fig. 3A, C). In the Pro treated discs the O2 consumption rate increased over time beginning at 4 hours into the incubation as expected (Fig. 3B, C, D). In figure 3D we compared two different Arabidopsis genotypes. The assay was able to detect previously observed phenotypic differences between lines in terms of their response to external Pro, using six replicates.
Data Quality
The key factor is technical variation between measurements. The replicate traces for control treatments demonstrated low technical variation compared with other respiration measurement devices: the coefficient of variation was 22.7 % (and this includes biological variation, so underlying technical variation was even lower). This low CV is crucial as it makes it easier to determine differences among sample types with reasonable replicate numbers. The increased variation in O2 consumption rates in Pro treated leaf discs was expected as the response to Pro is less uniform among leaf discs due to biological variation.
The 15 s frequency of measurements was more than sufficient to resolve time-dependent patterns in the data. The ability to control temperatures through placing the apparatus in incubators is another advantage for plant respiration research.
References
[1] Sew YS, Ströher E, Holzmann C, Huang S, Taylor NL, Jordana X, Millar AH. 2013. Multiplex micro-respiratory measurements of Arabidopsis tissues. New Phytologist 200: 922-32.
[2] Scafaro AP, Negrini ACA, O'Leary B, Rashid FAA, Hayes L, Fan Y, Zhang Y, Chochois V, Badger MR, Millar AH, et al. 2017. The combination of gas-phase fluorophore technology and automation to enable high-throughput analysis of plant respiration. Plant Methods 13: 16.
[3] O'Leary BM, Oh GGK, Lee CP, Millar AH. 2019. Metabolite regulatory interactions control plant respiratory metabolism via Target of Rapamycin (TOR) kinase activation. The Plant Cell 32: 666-682 .