

Watch tutorials, webinars and informative videos about PreSens optical sensor systems.
Optical pH Surveillance in a Microfluidic System for Cell Culture
Evaluation of VisiSens pH sensor foils integrated in microfluidic systems
A. Schopf1,2, C. Boehler1,2, M Asplund1,2
1Laboratory for Biomedical Microtechnology, Department of Microsystems Engineering (IMTEK), University of Freiburg, Germany
2Brain Tools Cluster of Excellence, University of Freiburg, Germany
pH surveillance within microfluidic systems is a challenging problem. Liquid quantities available for measurement are limited and also relatively inaccessible within the microchannel. In addition, the absence of turbulent mixing implicates that pH gradients build up easier than in macroscopic settings which in turn makes single point measurements rather unreliable for describing the state in the whole system. By using the VisiSens fluorescent sensor foils mounted within the microfluidics, pH can be monitored via ratiometric image analysis. Gradients can easily be detected and by carefully calibrating the system prior to experiments pH can be quantitatively determined.
It is a well-established fact that liquids in a microfluidic system follow the rules of laminar flows, preventing mixing, in contrast to the macroscopic world where two liquids in contact rapidly mix. This can lead to the formation of substantial concentration gradients. While laminar flows in many cases are a technological advantage of microsystems it can also be a cumbersome problem for experiments where uniform conditions are essential, e. g. ensuring an even pH distribution in microfluidic cell culture environment. The integration of microsensors into such systems is possible but single spot measurements do not give information about the distribution over the surface. There is the risk that hot spots in the fluidics, meaning regions were gradients build up, would be overlooked by such an approach. With foil based optical sensors, such as the VisiSens pH sensitive foils (SF-HP5R, PreSens) surface measurement of pH is possible via fluorescence ratiometric imaging. By integrating the foil in a transparent microfluidic channel, surface measurements can be performed and regions of distinctly different pH will stand out from the rest in the final processed image. In order to quantify the difference, the ratios in the image must first be translated to pH via a separate calibration measurement.
Set-up for pH Measurements
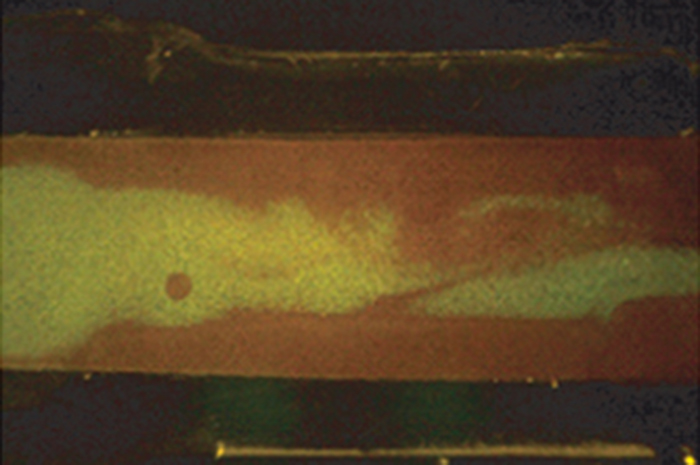
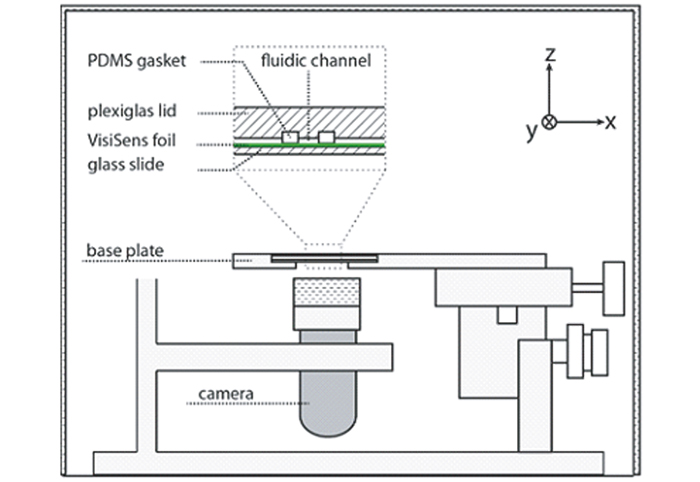
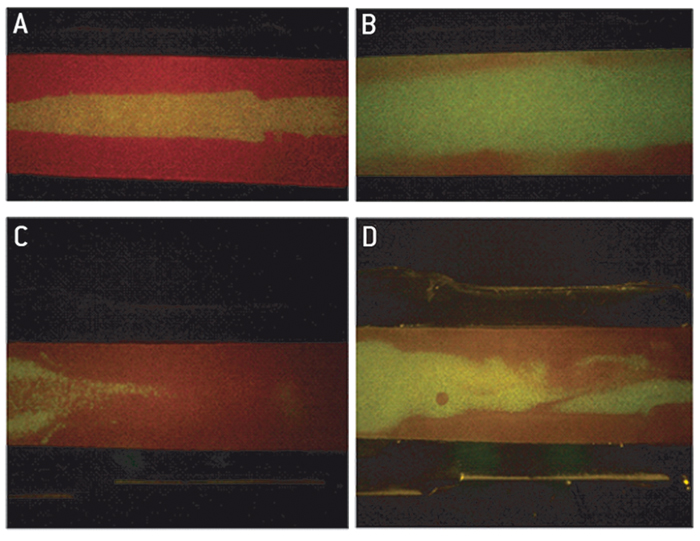
A test set-up was assembled using a rigid stainless steel stand with the camera clamped to it. It was facing the sample mounted on a 3D micromanipulator screwed to the bottom of the steel stand (Fig. 1). The sample could thus easily be moved in the x-y and z axis for alignment to the camera optics. The full system was enclosed in a box to exclude ambient light during measurements. The fluidic channel consisted of a silicon rubber gasket clamped between a lid of transparent poly-methyl- methacrylate and a glass cover slip. The sensor foil was glued onto the glass slide prior to mounting the gasket, and imaging was performed through the glass from below. A typical image captured with the VisiSens USB microscope can be seen in Fig. 2A. The contour of the gasket can easily be distin- guished on the picture. The sharp edges typically seen at the beginning of the measurements become more blurred over time as liquid soaks the sensor foils and diffuses within the sensor layer (Fig. 2B). Calibration buffers were prepared from sodium dihydrogen phosphate dihydrate and di-sodium-hydrogen phosphate dihydrate and adjusted to five different pH values. The example images in Fig 2 C-D are produced by first filling the channel with the most acidic buffer and then adding the basic buffer to the right side of the channel.
Calibration
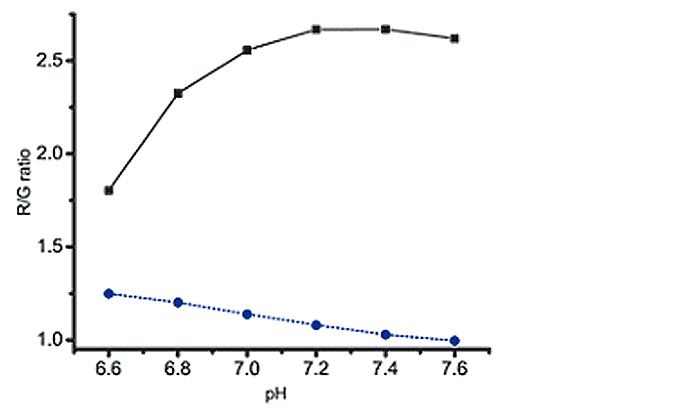
Ratiometric image analysis is an efficient method to get a quick impression of gradients or hot spots appearing within the channel. An example can be seen in Fig. 2 C-D, where the mixing of an acidic (pH = 4.5) and a basic (pH = 8.5) liquid in the central region of the channel was visualized. Nevertheless, it is often necessary to translate the signal to specific pH values. Calibration is performed by filling the channel with buffers of known pH and image recording after the foil has equilibrated with the new solution. A non-linear calibration curve is established by which the calculated ratios can be interpreted to pH values. Four possible interferences need special consideration in order to obtain an accurate calibration measurement: foil equilibration time, buffer contamination, colorimetric interference and progressive weakening of the signal over time due to photobleaching. If the equilibration is incomplete, there could be interference with the signal of the previous buffer filling. Our tests showed that one should wait for at least 8 min between filling the liquid into the channel and capturing the image for calibration, but each user should invest a few initial measurements to figure out optimal parameters in their case. Also rinsing between buffer fillings preferably with the next buffer to be measured avoids substantial contamination from one buffer to the next. Fig. 3 shows our results when we conducted calibration with and without rinsing. There is a clear lag in the signal from one measurement to the next when the channel is not rinsed, while in the rinsed version the signal does not depend on the sequence in which the buffers are measured. Therefore, we recommend rinsing in-between calibration points to improve the accuracy of the calibration. Furthermore, colorimetric pH indicators, such as phenol red, can interfere with the pH sensor foil´s signal. Such substances are routinely added to full cell culture media as a quick surveillance method for the health status of the culture. We observed a major shift in the sensor signal when we performed calibration in buffers with or without phenol red (Fig. 4). This clearly shows the importance of working in phenol red free medium when performing measurements with the pH sensor foils. Also photobleaching of the fluorescent sensor dye is a factor that should not be neglected when using the sensor over longer time periods. Prolonged illumination can cause a signal drift over time and therefore re-use of the foils is not recommended for high precision measurements. A second calibration after long-term measurements should be performed. This way it is possible to estimate how signal drift might have influenced the measurements.

Conclusion
For rapid qualitative analysis of pH gradients the VisiSens pH sensor foil is an efficient method as can be seen in Fig. 2 C-D. However, for quantitative pH measurement within microscale fluidic systems the above mentioned points must be taken into consideration. It is clear that accurate pH determination via the foil requires a carefully planned calibration sequence both prior and after experiments. On the other hand, an excessively long calibration procedure will contribute to signal weakening over time due to photobleaching, so the right balance has to be found.