

Watch tutorials, webinars and informative videos about PreSens optical sensor systems.
The Stern-Volmer-equation
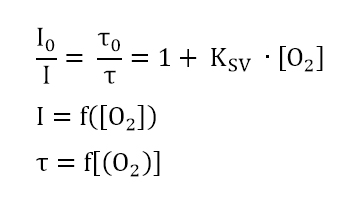
A relation exists between the oxygen concentration in the sample and the luminescence intensity as well as the luminescence lifetime which is described in the Stern-Volmer-equation (1). Here, τ0 and τ are the luminescence decay times in absence and presence of oxygen (l0 and l are the respective luminescence intensities), [O2] the oxygen concentration and KSV the overall quenching constant
l: Luminescence intensity in presence of oxygen
l0: Luminescence intensity in absence of oxygen
τ: Luminescence decay time in presence of oxygen
τ0: Luminescence decay time in absence of oxygen
KSV: Stern-Volmer constant (quantifies the quenching efficiency and therefore the sensitivity of the sensor)
[O2]: oxygen content
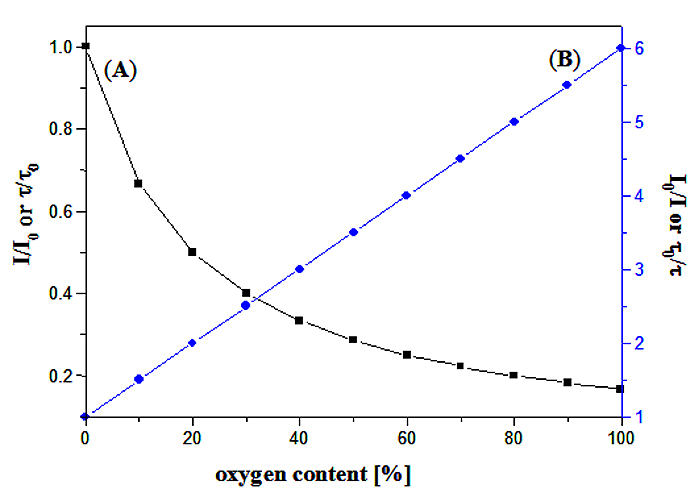
(A) Luminescence decrease in the presence of oxygen. (B) Stern-Volmer plot.
Indicator dyes quenched by oxygen are, for example polycyclic aromatic hydrocarbons, transition metal complexes of Ru(II), Os(II) and Rh(II), and phosphorescent porphyrins containing Pt(II) or Pd(II) as the central atom.
It is important to mention that the quenching effect is highly specific for molecular oxygen. Effects of varying pH-values, ionic species and other solutes in the sample are avoided by embedding the oxygen sensitive indicator in an ion-impermeable matrix.
In contrast to the amperometric oxygen electrodes, optodes are in a thermo-dynamical equilibrium and not in a steady state. Therefore, no oxygen is consumed during the measurement and the signal is independent from changes in flow velocity. The calibration function of oxygen optodes only depends on the composition of the sensing layer. So it is possible to design sensors with a tailored oxygen sensitivity.