

Watch tutorials, webinars and informative videos about PreSens optical sensor systems.
How Much O2 Do Cells Really Face?
Continuous assessment of vertical O2 gradients in static adherent cell culture with the VisiSens™ MIOS system
L. Sauer1, D. Obermeier2, G. Liebsch2, R. J. Meier2, J. Wegener1,3
1Intitute of Analytical Chemistry, Chemo- and Biosensors, University of Regensburg, Regensburg, Germany
2PreSens Precision Sensing GmbH, Regensburg, Germany
3Fraunhofer Research Institution for Microsystems and Solid State Technologies (EMFT), Regensburg, Germany
This application note describes a method to continuously measure vertical oxygen gradients (VOGs) non-invasively in cell culture vessels using a cell culture imaging insert called MIOS (Multiwell Insert Optical Sensor) and the VisiSens™ imaging technique. The results show a significant difference between 'assumed' and actual cell culture conditions.
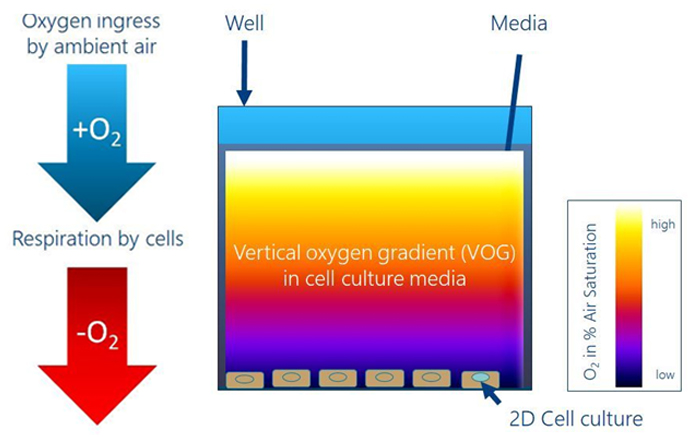
The 2019 Nobel Prize for Medicine has brought to everyone's attention that mammalian cells respond to pericellular oxygen concentrations in very complex, tissue specific and strictly controlled changes of gene expression, which induces changes in metabolism and other aspects of cell physiology. Most known facts about cellular response to different O2 levels have been learned from studying cells in tissue culture. Adherent cells are routinely grown under static conditions in a humidified incubator with an atmosphere of 95 % ambient air and 5 % CO2 at 37 °C. It is well known that the height of the culture fluid covering the adherent cells is critical to allow sufficiently fast diffusion of O2 from the air-liquid interface to the bottom of the culture dish. But the details of this vertical oxygen gradient (VOG) are only poorly understood since it affected by several parameters: (I) the cells' respiration rate, (II) the number of cells per unit area, (III) the composition of the medium, as it determines which metabolic pathways are active, (IV) the total volume of oxygenated medium and (V) the rate of O2 ingress from the atmosphere into the medium. Hence, estimating the VOG from the air-liquid interface (source) to the cells at the bottom of the dish (sink) (see Fig. 1) is a multifactorial problem that calls for experimental assessment for various cell culture conditions and geometries. Detailed and time-resolved knowledge about this gradient allows better control and standardization of O2 levels that cells are facing. It is obvious that differences in cell oxygenation may be a potential source for poor lab-to-lab reproducibility of cell experiments since the pO2 directly affects energy metabolism and acts as a powerful lever of gene expression and phenotypic changes.
Materials & Methods
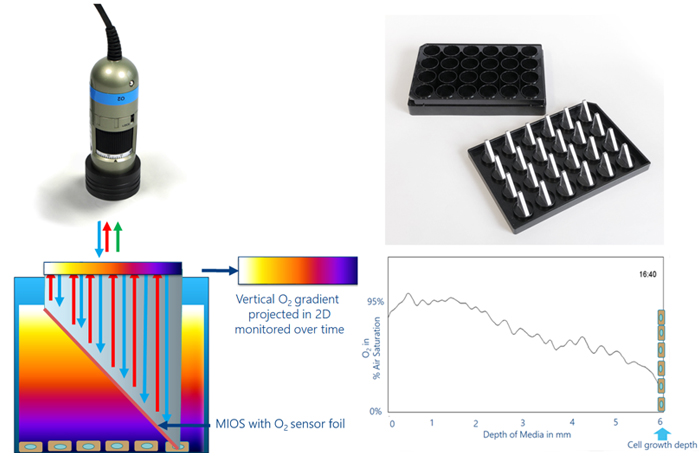
The VOG from the air-liquid interface of medium and atmosphere to the adherently growing cells on the bottom of a regular cell culture dish was measured using the VisiSens™ A1 oxygen imaging set-up along with O2-specific MIOS sensors (Fig. 2). The MIOS system consists of a holder that matches the format of a 24 well plate and holds up to 24 individual MIOS that will dip into the cell culture fluid of any of the wells from above. The MIOS sensors are optical light guide elements, with the sensitive part shaped like a right triangle (Fig. 2). One leg is parallel and close to the air-liquid interface forming the read-out plane, while the other led is orthogonal to the bottom of the culture surface dipping into the medium so that the hypothenuse provides an inclined plane in the culture liquid. This inclined, sloped side of the 'triangle' is coated with an SF-RPSu4 oxygen sensor foil. The sensor is in direct contact with the culture fluid in all height levels from the cell layer up to the air-liquid interface. When the VisiSens™ detector is focused on the horizontal leg of the MIOS, the excitation light propagates through the light guide element and excites the luminescent dyes in the sensor foil. One of the dyes is quenched by oxygen, while the other one is insensitive to O2 and serves as an internal reference for ratiometric quantification. The luminescences from the different positions of the sensor foil (vertical gradient) are projected back to the MIOS leg that runs parallel to the surface, being converted into a horizontal gradient. The gradient is imaged with the VisiSens™ detector unit. Knowing the geometric dimensions of the MIOS triangle, provides a well-defined relationship to convert the x-position of the horizontal gradient into the z-position of the VOG. Hence, the MIOS allows imaging of VOGs in 24 well plates and paves the way for systematic studies on how different experimental parameters affect the O2 distribution inside cell culture fluids and the availability of O2 for adherent cells on the well's bottom.
In this study the MIOS sensor was applied to record and evaluate the VOGs in the medium above confluent in vitro cultures of normal rat kidney (NRK) cells. Suspended NRK cells were seeded in a cell density of 2.5 105 cells / cm2 into a 24 well plate. Cells were allowed to attach and spread for 48 h. After preculture, regular cell culture medium was replaced with L-15 medium without phenol-red. The cells were then monitored with the MIOS system at 5 % CO2 at 37 °C for 24 h. Automated time-series recording and evaluation of the O2 images was performed with the VisiSens AnalytiCal 1 software followed by data processing using the ImageJ StackPlotProfile plug-in.
Results
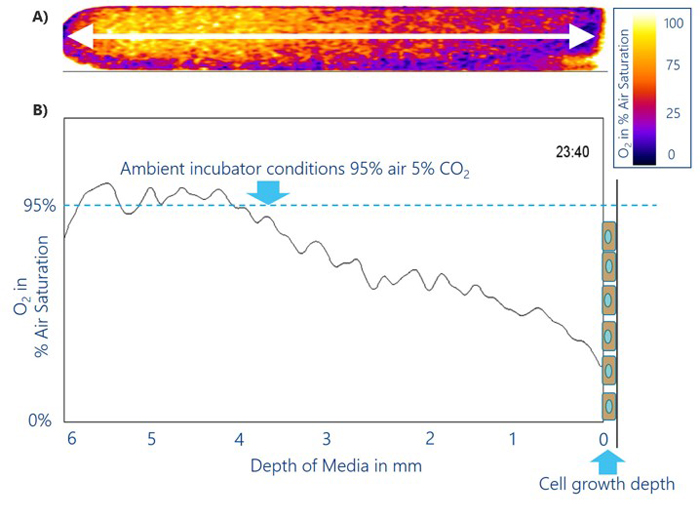
The MIOS system was applied to NRK cell culture with a fluid height of approx. 6 mm from the bottom of the culture dish towards the air-liquid interface. The MIOS covers this full liquid height from 0 to 6 mm and enables continuous monitoring of the VOG. Figure 3A shows the imaging data of the established VOG in the medium encoded in pseudo-color. The left side represents conditions close to the air-liquid interface. In these topmost liquid layers, the medium O2 saturation equals incubator conditions (95 % air saturation), down to 2 mm below the interface. Apparently, oxygen ingress from ambient air across the interface (1.4 cm2) compensates for oxygen diffusion towards the consuming cells. Deeper inside the cell culture fluid (2 to 4 mm form the surface) an approximately constant gradient is observed. Within this zone, oxygen levels decrease from 95 % air sat. to 38 % air sat. in 2 mm distance from the cells. This nearly linear gradient indicates the increasing decline of oxygen from the differential liquid layers by the cells respiratory activty and insufficiently fast diffusive O2 replenishment from the interface. In the liquid layer 1 mm above the cell layer local O2 content drops to 20 % air sat. close to the cell surface. A depletion zone evolves and cells at the bottom of the dish experience a significantly lower O2 level than might be expected from the O2 content in the incubator atmosphere and the solubility of O2 in physiological buffers. In reality cells face severe hypoxic conditions when grown in a normoxic incubator. The accompanying changes in energy metabolism and functional cell phenotype remain to be studied, for instance, by systematic comparison of cells under static and under flow conditions.
Switching from local to time-dependent analysis, the O2 concentration within 0.3 mm of medium height above the cell layer (= volume of interest VOI) can be quantitatively followed for 24 h after medium exchange (Fig. 4) in the same experiment. The VOI was averaged every 10 minutes and plotted as a function of time (Fig. 4B). Over the first 6 h after medium exchange, O2 levels in the VOI decreased from initial 55 % air sat. to constant values of 20 % air sat., which is indicative of hypoxic conditions after a culture time of just 6 h for the conditions in this experiment (6 mm fluid height). The initially well oxygenated fresh medium is depleted of O2 due to continuous cellular respiration and the insufficient O2 ingress / diffusion rate. 20 % air sat., the stationary condition after 6 h, amount to 1.35 mg/L or 42.1 µmol/L O2 in the VOI.

Discussion & Conclusion
NRK cells were cultivated at conditions that are widely regarded as 'standard conditions' at 37 °C in a conventional incubator with stable 5 % CO2 in the humidified atmosphere. The remaining 95 % of the incubator atmosphere consisted of 20.9 % O2 at 1.020 mbar ambient air pressure. Thus, the O2 content in normoxic conditions amounts to 19.9 % (142.9 torr) or in aqueous media (physiological salinity) to 6.4 mg/L or 199.9 mol/L of dissolved oxygen. It is widely assumed that living cells in culture are exposed to this pO2 throughout their in vitro lifetime. However, since cells consume O2 at individual rates and O2 ingress is different in cell culture vessels with diverse geometries, the actual pO2 experienced by the cells is often significantly different. This may account for differences in metabolic activity or even functional phenotypes. Accordingly, it is mandatory for standardized and reproducible cell culture experiments to know and control the local O2 availability in a given experimental scenario. the presented MIOS sensor helps to overcome the current limitations in assessing the local O2 availability in cultures. Along with the VisiSens™ set-up, it allows measuring the VOG in cell culture fluids between the air-liquid interface and the cell layer at the bottom of 24 well plates. Our study clearly shows how the oxygenation in the medium changes in the vertical profile as well as over time. The data quantitatively proves that cells cultured nominally under normoxic conditions experience hypoxia in their direct local microenvironment. The degree of O2 depletion in the pericellular region is multifactorial and as such dependent on fluid height and metabolic activity of the cell under study. The MIOS technique provides quantitative insight on true O2 levels in the cellular microenvironment when cultured under 'standardized' incubator conditions of 95 % air saturation. It reveals the degree of hypoxia for given experimental settings and may be the basis for more accurate standardization of cell culture conditions and improved reproducibility of cell-based assays.