

Watch tutorials, webinars and informative videos about PreSens optical sensor systems.
Imaging with Planar Optodes for Investigating Spatio-Temporal Gradients
Nature is full of gradients and concentration inhomogeneity. Oftentimes huge differences are observed when measuring an analyte such as O2, pH or CO2 at various positions in a sample, no matter if it is of natural or artificial origin. In many cases, big efforts are made to homogenize samples via stirring, shaking or other mixing methods in order to build even reaction conditions in the whole sample. However, if we are interested in investigating our environment, we should not alter nature. Many samples or experiments have designated sites, so-called hot spots or spatially restricted areas, where most part of a reaction takes place. This is the case when investigating sediment-water, root-soil, soil-air, liquid-gas or liquid-liquid interfaces. Thereby gradients are built inside the sample or a sample area. These mostly consumption- or diffusion-based gradients are important to investigate, control and/or optimize.
Methods to control and investigate concentration gradients or inhomogeneity are for example:
- simultaneous measurement at several measurement positions (A. Flohr et al. "Assessing the Impact of pH Fluxes", M. Köster "Monitoring Oxygen Dynamics at the Sediment-Water Interface")
- analyte profiling by moving one sensor in different positions (K. Koop-Jakobsen and M. Gutbrod "O2, pH and CO2 Dynamics in Salt Marsh Tidal Ponds")
- or the use of 2D read-out (K. Vopel et al. "Benthic Disturbance Recovery")
Multipoint measurements need manual repositioning of the read-out unit, multiple read-out units, or a multi-channel device to cover and record a multitude of measurement spots in the same experiment. For the user this is often a matter of time, free space around the sample and the complexity of the read-out system. Microprofiling is discussed in a separate basics section (see Microprofiling). Here we want to point out the beneficial use of 2D read-out with luminescent chemical optical sensors.
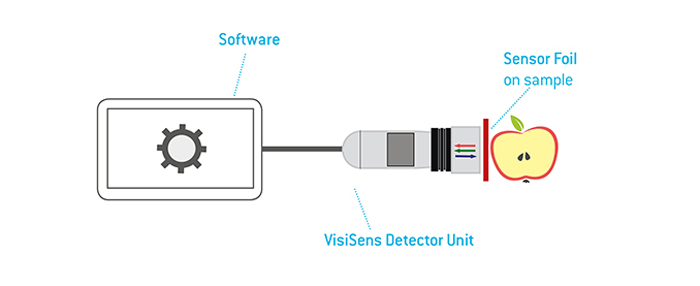
2D read-out of optical sensors or so-called analyte Mapping or Imaging uses a 2D array detector to record a multitude of signals or measurement points, respectively, at the same time and within the very same experimental read-out (O. S. Wolfbeis, BioEssays 2015, 37, 8). Special luminescence camera detectors instead of single channel photodetectors are used to perform the 2D signal reading of planar optode sensors. Such a system for 2D reading of optical sensors consists of three major parts:
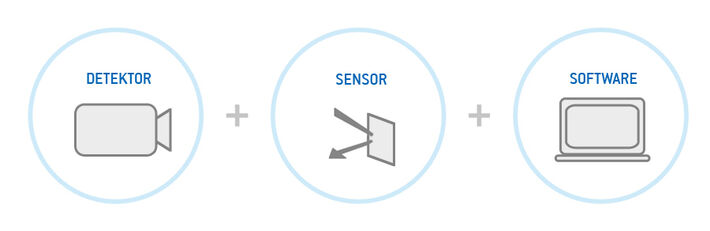
A camera detector unit is used for two main purposes, the generation of excitation light signals and the collection of luminescence emission signals in a 2D manner. Second part is at least one luminescent sensor element that interacts with the sample in a reversible way and generates analyte dependent luminescent changes upon excitation. The third element is a software that transforms the recorded raw light signal data into an analyte dependent data array or image.
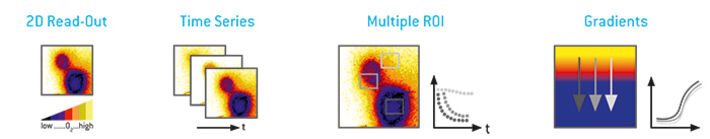
Imaging enables to detect thousands of measurement spots at the same time and to generate 2D analyte maps over a region of interest. Furthermore, automated time series recordings allow to analyze spatio-temporal changes of the respective analyte. The data results in a visual representation (image, map or video slide-show) of the analyte distribution that can be used to quickly identify spatial and temporal differences or hot spots of metabolic or reaction activity. This gives a quick and easy overview on what is going on in the sample. Besides this, each measurement element (each pixel) contains information on the analyte at that specific position as a second level of information. Freely selected Regions of Interest (ROIs) allow analyzing and comparing regions. Several gradients can also be analyzed within one image, or can be compared at different time points.
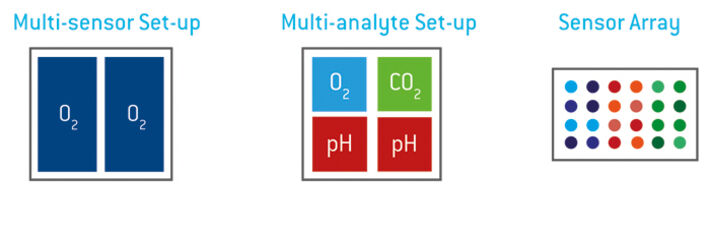
Besides this 'picture filling' 2D imaging approach, where the whole field of view contains sensor information, imaging offers more advanced possibilities: Multiple sensors can be combined in one field of view., so that either various positions in one experiment or even several samples can be recorded simultaneously. Moreover, several sensor types for one analyte, e.g. with different ranges, can be combined in one sample to extend the measurement range. Furthermore, sensors for different analytes can be combined in one field of view and read out with the same device in the same experiment, or even whole sensor arrays can be recorded at the same time (Y. Reinders et al. "Imaging of pH and pO2 on Irradiated Fibroblasts").
Fluorescence Ratiometric Imaging (FRIM) is a method for reading out the signal of a fluorescent chemical optical sensor. Ratiometric measuring compensates most of the common interferences, e. g. inhomogeneous lightfields. An optical sensor foil contains an analyte sensitive dye and a reference dye which are immobilized in a permeable polymer matrix layer. The indicator dye is emitting red or green fluorescence, depending on the analyte and respective sensor foil type, which is dynamically quenched by the analyte while the reference dye is giving a constant green or red light signal respectively. These emissions meet exactly the red and green channel sensitivity of a color RGB chip.

Measurement Principle of the VisiSens™ Imaging System - FRIM
Fluorescent Ratiometric Imaging (FRIM) is a method for the referenced read-out of a fluorescent chemical optical sensor's signal (Tschiersch et al. "Planar oxygen sensors for non invasive imaging in experimental biology" Microsensors. IntechOpen, 2011). Ratiometric measuring compensates most of the common interferences, e.g. inhomogeneous light fields or geometrical changes. An optical sensor foil contains an analyte sensitive dye and a reference dye, which are immobilized in an analyte permeable polymer matrix layer. The indicator dye is emitting red (or green, depending on the analyte and respective sensor foil type) fluorescence signals that are changing dynamically with varying analyte concentration. The reference dye gives a stable and constant light signal. These emissions from indicator and reference meet exactly the red and green channel sensitivity of a color RGB chip in a digital camera. The RGB chip records these signals separately and stores the respective information in the independent color pixels, resulting in a 'color' image. The recorded red and green channel information can be referenced ratiometrically, resulting in a referenced 2D sensor response.
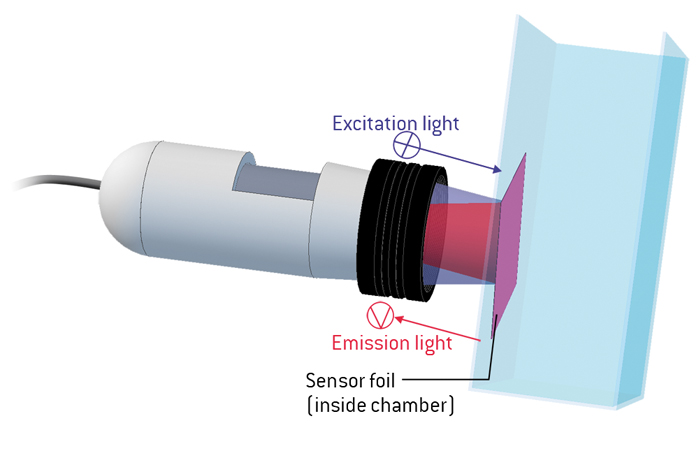
Contactless Direct Sensing or Read-Out Through Transparent Walls
The planar sensor foil can directly be applied on a surface of interest and 2D analyte images can be recorded. As light signals can also pass transparent vessel walls, the sensor foil can be attached to the inner wall of a transparent or even slightly opaque container and signals can be read out in a non-invasive manner through the vessel wall.

Which one to choose for your application

| Feature | VisiSens A1 | VisiSens TD | |
|---|---|---|---|
| Field of View | Small (up to 3 x 2 cm2) | x | |
| Medium (up to 8 x 6 cm2) | x | ||
| Large (up to DIN A4, 21.0 x 29.7 cm2) | x with Big Area Imaging Kit | ||
| Microscopic | x | x with TD MIC Kit | |
| One analyte only | x | x | |
| O2, pH and CO2 with one system | x | ||
| Combine multiple sensors | x | ||
| Modular system: Add new analyte modalities to software | x | ||
Detector | High grade detector | x | |
| Perfectly balanced components | x | x | |
| Ready-to-use | x | x | |
| Mobile device | x USB powered | PoE powered |
Find your perfect imaging set-up with our Product Finder
VisiSens Ax Series:
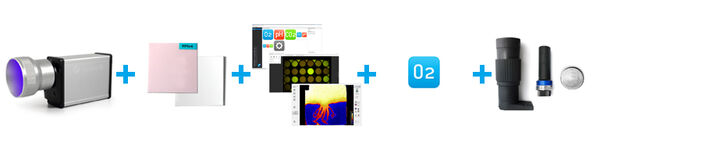
VisiSens A1 O2 Imaging
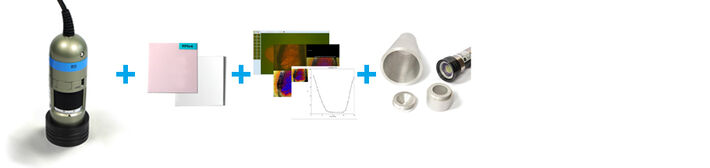
- VisiSens DU01 + Sensor Foil SF-RPSu4 + VisiSens AnalytiCal 1 Software + Adapter Tubes (optional)
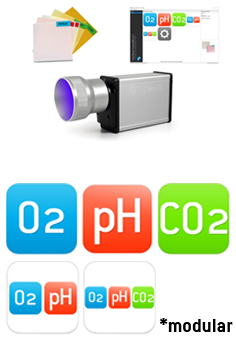
VisiSens TD Series:
VisiSens TD Basic System
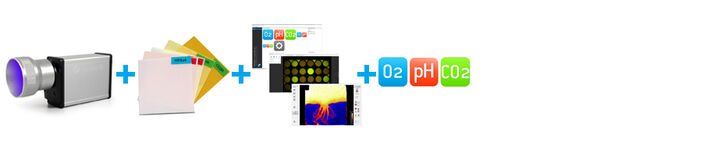
- VisiSens TD Basic System + Sensor Foils SF-RPSu4 and/or SF-HP5R and/or SF-LV1R and/or SF-CD1R + VisiSens ScientifiCal Software + Imaging Modalities for O2, pH and/or CO2
VisiSens TD Big Area Imaging
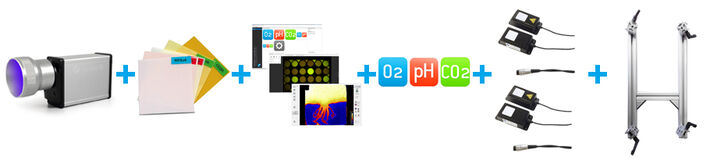
- VisiSens TD Basic System + Sensor Foils SF-RPSu4 and/or SF-HP5R and/or SF-LV1R and/or SF-CD1R + VisiSens ScientifiCal Software + Imaging Modalities for O2, pH and/or CO2 + Big Area Imaging Kit + Mounting Rack
VisiSens TD Mic Configuration
- VisiSens TD Basic System + Sensor Foil SF-RPSu4 + VisiSens ScientifiCal Software + Imaging Modalities for O2 + VisiSens TD Mic Kit
VisiSens TD Basic System for Imaging Sensor Plates (ISP)
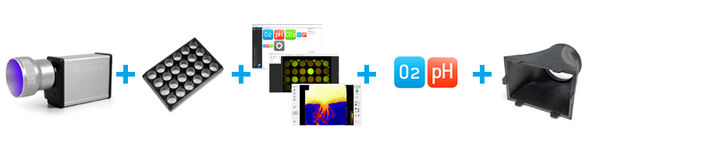
- VisiSens TD Basic System + Imaging Sensor Plate ISP96-RPSu4-S, ISP24-RPSu4-S for O2 or ISP96-HP5R-S, ISP24-HP5R-S for pH + VisiSens ScientifiCal Software + Imaging Modalities for O2 and/or pH + Sensor Plate Adapter Tubus