

Watch tutorials, webinars and informative videos about PreSens optical sensor systems.
A Microfluidic Platform for Real-Time Non-Invasive Monitoring of Microglia Polarization
Application of novel optical SensorPlugs for microfluidics
Elifsu Polatli1,2, Alperen Yilmaz1,3, Resul Özbilgiç1,2, Íbrahim H. Erbay1,2, Duygu Sağ1,2,4, Sinan Güven1,2,4,*
1Izmir Biomedicine and Genome Center, Izmir, Turkey
2Dokuz Eylul University, Izmir International Biomedicine and Genome Institute, Izmir, Turkey
3Ankara University, Department of Biomedical Engineering, Izmir, Turkey
4Dokuz Eylul University, School of Medicine, Izmir, Turkey
*Corresponding author: sinan.guven@ibg.edu.tr
In this study, we hypothesized that sensor systems can be utilized for non-invasive real-time monitoring in microglia metabolism to further elucidate the polarization levels towards a specific phenotype under dynamic microenvironment. We designed and fabricated a microfluidic chip to culture microglia under continuous flow and correlate changes in oxygen and pH with polarization state upon activation.
Inflammation is a complex series of events triggered by stimuli such as foreign antigens, pathogens, and chemicals. It plays a key role in different diseases such as autoimmune disorders, cancer and wound healing processes [1]. Macrophages and microglia have a major role in inflammation and neuroinflammation respectively due to their antigen presentation, phagocytosis, and immunomodulation properties [2]. Microglias as a subtype of macrophages also act like macrophages in neural immune response [3]. Microglia can transform into two different phenotypes named as M1 and M2 according to the signals they are exposed to in their physiological microenvironment [4]. Proinflammatory M1 microglia also termed ‘‘classically activated’’ can be induced by lipopolysaccharide (LPS), whereas IL-4 and IL-13 induce ‘‘alternatively activated’’ anti-inflammatory M2 phenotype [5,6]. In response to stimulation towards an M1 phenotype, it has been shown metabolic changes occur in macrophages and microglia. During LPS stimulation, the produced Nitric Oxide (NO) inhibits the oxidative phosphorylation, which causes cells to switch to glycolysis. Due to this response, there is an increase in the lactate production, which in turn increases the extracellular acidification rate (ECAR). Monitoring the alterations in pH gives insights to the physiologic and metabolic state of cells and tissues [7]. Polarization state of microglia can be conventionally detected by gene expression, cell surface markers and proteins released to the culture media or accumulated in extracellular matrix. In this regard PCR, flow cytometry, ELISA and Western Blotting are among the most common methods, which are invasive, laborious and time consuming. These techniques also do not provide insights and real time monitoring on changes in polarization states during the in vitro experiments. Microfluidic organ-on-a-chip systems provide excellent in vitro platforms to mimic complex organs/tissues by providing 3D hierarchical architectures with dynamic culture models for heterogeneous cell populations. Neuroinflammation model for diseases with complex etiology has previously been reported which further highlighted the advantages of bioengineered microenvironments [8].
Materials & Methods
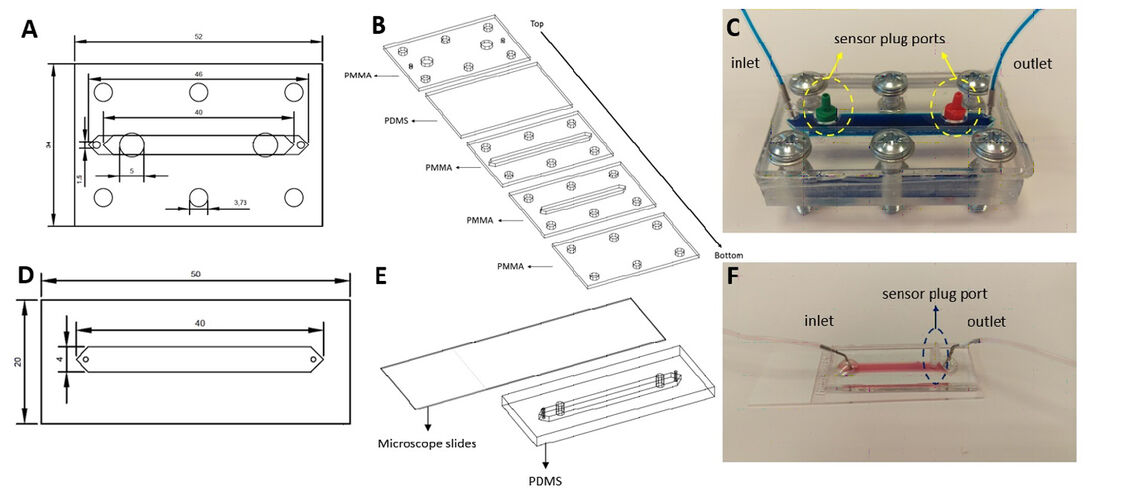
Microfluidic chips were fabricated from Polydimethylsiloxane (PDMS) due to its flexibility, which ease inserting sensor plugs and sealing for leakage. To create the PDMS components of the chips, PDMS was cast on Polymethylmethacrylate (PMMA) molds with a 1:10 mixture of curing agent and PDMS, respectively. After degassing under vacuum, the molds were baked at 80 ºC for an hour and the chips were cut out of the molds. Chip A is a hybrid chip that includes PMMA and PDMS components. The bottom part of the chip contains a channel for the 3D culture and fluid flow with a PDMS layer over those layers with inlet, outlet and sensor plug ports. There is an additional PMMA layer enclosing the chip to provide structural support to the fiber optic cables that facilitates the compression of the bolts. All of these layers were combined together with the help of 6 bolts (Fig. 1C). Chip B has two layers. After soft lithography, the manufactured PDMS components were plasma-bonded to microscope slides. After bonding, these chips were placed on a 120 °C hot plate for 2 hours to enhance bonding strength.
N9 mouse microglia cell line was used for macrophage polarization experiments. Complete RPMI (phenol-free) medium 1640 (supplemented with 10 % Fetal Bovine Serum (FBS) and 1 % Penicillin/Streptomycin (Pen/Strep)) was used for cell expansion. Cells were cultured up to 80 % confluence and harvested with 0.25 % Trypsin-EDTA. Ethanol sterilized chips were seeded with high cell density (4.5 x 10⁵ cell/cm2) and incubated overnight at 37 °C and 5 % CO2 under static conditions.
Once microglia cells adhere and form monolayer culture, 0.5 µl/min continuous flow has been administered with syringe pump (Harvard Apparatus) (Fig. 2). Microglia cells were polarized into M1-like phenotype with 300 ng/ml lipopolysaccharide (LPS) for 24 h. Unstimulated cells were used as a control group throughout the study. Microfluidic chips were placed in a cell culture incubator and the sensor plugs were connected to the fiber optic cables. Oxygen and pH sensor measurements were collected for 24 hours. During data acquisition incubator was not opened to avoid any gas and temperature fluctuation.

After 24 hours of dynamic culture in microfluidic chips a lysis buffer with 15 µM dithiothreitol (DTT) was pipetted into the channel to lyse the cells. The lysate was collected and stored at -80 °C for RNA isolation. RNAs were isolated with Macherey-Nagel RNA Isolation Kit. Control and M1 groups were compared according to their TNFα, IL-6 and iNOS gene expression levels with qPCR analysis.
Supernatant collected from the outlets of microfluidic chips during the 24 h incubation was used for ELISA. Affymetrix eBioscience Mouse TNFα Kit has been utilized according to the manufacturer instructions. To validate our sensor readings and confirm the M1 polarization, we determined the levels of TNFα released from control and M1 groups.
Results
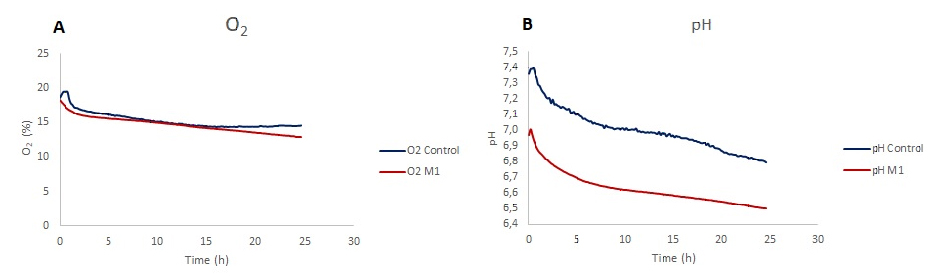
Dissolved oxygen showed a decrease in the LPS stimulated microglia and unstimulated control group. While there is a similar trend at the beginning for both conditions, in 24 h of stimulation period oxygen levels for M1 polarized microglia are lower than control. The decrease in the dissolved oxygen levels for control is 22.2% and 29.5% for LPS stimulated cells (Fig. 3A). In pH monitoring chips, pH level decreases over a 24 hour time course where the final value for control is 6.8 and for LPS stimulated cells is 6.5.
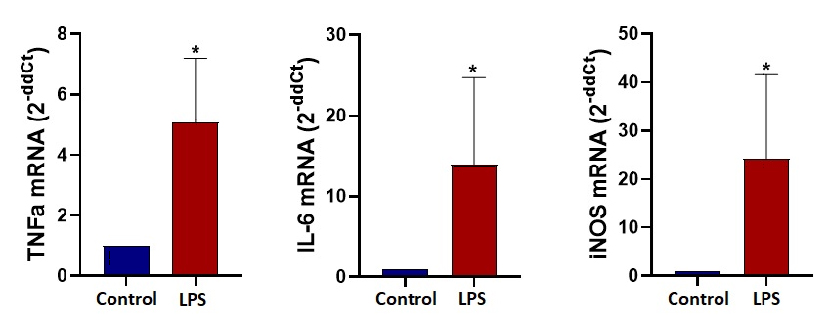
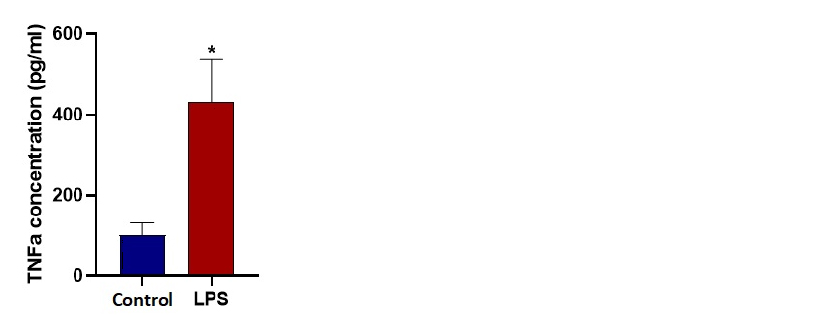
Gene expression analysis at the end of the 24 hours for TNFα, IL-6 and iNOS demonstrates significant fold change confirming M1 polarization for LPS stimulated microglia cells under dynamic microfluidic culture. An ELISA assay demonstrates the significant increase in the TNFα cytokine released from LPS stimulated cells (M1). TNFα concentrations after 24 hours under dynamic conditions was measured as 102 pg/ml for unstimulated control and 470 pg/ml for LPS stimulated microglia cells.
Discussion
The initial aim of this study was to observe metabolic changes that take place in microglia during polarization in 3D culture. For this purpose we designed and fabricated Chip A for 3D dynamic culture and stimulated cells towards M1 phenotype. We observed that cells in 3D culture are not effectively polarized compared to 2D culture. We conclude that the low number of successfully polarized cells may not be adequate to change the overall metabolic measurements. To demonstrate the strength of the novel sensing system in microfluidic studies we focused on more conventional 2D culture and discussed the results with literature. Therefore, we decided to do a 2D dynamic monolayer culture inside a microfluidic chip. These results also led us to change the microfluidic Chip A to Chip B. After 24 hours of stimulation, we ensure the success of M1 polarization by qPCR analysis. mRNA expression levels of typical M1 state markers TNFα, IL-6 and iNOS were significantly higher than the control groups. Next, we show that stimulated cells actually complete the translation process from mRNA to the protein level. To do that, we determined the levels of secreted TNFα protein in the outlet of the microfluidic chip by performing ELISA.
pH changes were in line with the literature: In several previous studies, the M1 polarization has been shown to cause a reduction in pH levels because the stimulated cells have a higher ECAR. In our study, we were able to observe much lower pH levels inside the LPS stimulated chip compared to the control chip. But when we looked at the initial pH levels of the chips they were different. That might be due to the bubble formation inside the microchannel. The bubbles can affect the dissolved gas concentration inside the medium of the chips and dissolved gases can change the pH of the medium. CO2 affects the medium by decreasing the pH, on the other hand if the medium is exposed to gas that is rich in oxygen, the medium pH will increase. If the control medium was exposed to O2 rich bubbles this could explain the higher pH values. There is one more possibility about the difference. Setting up the experiment and starting the measurements took about 40 minutes. The cells were exposed to stimulating factors before the measurements started. This might be due to the LPS stimulated cells’ lowering the pH level of the medium by the iNOS formation after the stimulation [7].
O2 levels were not in line with the literature: LPS stimulation of N9 microglia cells reduces the proliferation rate and changes the cell metabolism to become glycolysis dependent. These changes in cell metabolism lead to lower oxygen consumption and combined with relatively lower cell number due to cell cycle arrest [9] the dissolved oxygen level measurements of LPS stimulated cells would be expected to be higher compared to controls and must have an increasing trend over the 24 hour stimulation. Our results show 7% more decrease in oxygen levels of LPS stimulated cells. More experiments must be performed to better understand why this disagreement with the literature occurs.
References:
[1] Kumar, V., Abbas, A. K., Fausto, N., & Aster, J. C. (2014). Robbins and Cotran pathologic basis of disease, professional edition e-book. Elsevier health sciences.
[2] Fujiwara, N., & Kobayashi, K. (2005). Macrophages in inflammation. Current Drug Targets-Inflammation & Allergy, 4(3), 281-286.
[3] Shi, H., Wang, X. L., Quan, H. F., Yan, L., Pei, X. Y., Wang, R., & Peng, X. D. (2019). Effects of betaine on LPS-stimulated activation of microglial M1/M2 phenotypes by suppressing TLR4/NF-κB pathways in N9 cells. Molecules, 24(2), 367.
[4] Sica, A., Larghi, P., Mancino, A., Rubino, L., Porta, C., Totaro, M.G., Rimoldi, M., Biswas, S.K., Allavena, P. and Mantovani, A., 2008, October. Macrophage polarization in tumour progression. In Seminars in cancer biology (Vol. 18, No. 5, pp. 349-355). Academic Press.
[5] Gordon, S. (2003). Alternative activation of macrophages. Nat. Rev. Immunol. 3, 23–35.
[6] Mantovani, A., Sica, A., & Locati, M. (2005). Macrophage polarization comes of age. Immunity, 23(4), 344-346.
[7] Orihuela, R., McPherson, C. A., & Harry, G. J. (2016). Microglial M1/M2 polarization and metabolic states: Microglia bioenergetics with acute polarization. British Journal of Pharmacology, 173(4), 649–665.
[8] Park, J., Wetzel, I., Marriott, I., Dréau, D., D’Avanzo, C., Kim, D. Y., Tanzi, R. E., et al. (2018). A 3D human triculture system modeling neurodegeneration and neuroinflammation in Alzheimer’s disease. Nature Neuroscience, 21(7), 941–951.
[9] Ferreira, I. A., Porterfield, J. Z., Gupta, R. K., & Mlcochova, P. (2020). Cell Cycle Regulation in Macrophages and Susceptibility to HIV-1. Viruses, 12(8), 839.