

Watch tutorials, webinars and informative videos about PreSens optical sensor systems.
Energy Catabolism Measurements in Metastatic Macrophage M3 Cells
Cell respiration measurements with the SDR SensorDish Reader and the XF 96 Extracellular Flux Analyzer
Robert Flores1, Brian Coy2, Karen Studer-Rabeler2, and Thomas N. Seyfried1
1Biology Department, Boston College, Chestnut Hill, MA, USA
2Coy Laboratory Products, Inc., Grass Lake, MI, USA
In order to study the role of mycoplasma infection on cancer cell energy catabolism, we measured oxygen consumption and lactate production in either infected or non-infected metastatic macrophage M3 cells. We applied two different oxygen measurement systems, the SDR SensorDish® Reader by PreSens and the XF 96 Analyzer by Seahorse Bioscience, to investigate cell respiration. These systems are based on different oxygen measurement principles, but they provided similar results indicating that mycoplasma infection may have an effect on overall cell catabolism. Analysis of lactate production in infected and non-infected M3 cells confirms the oxygen measurement results.
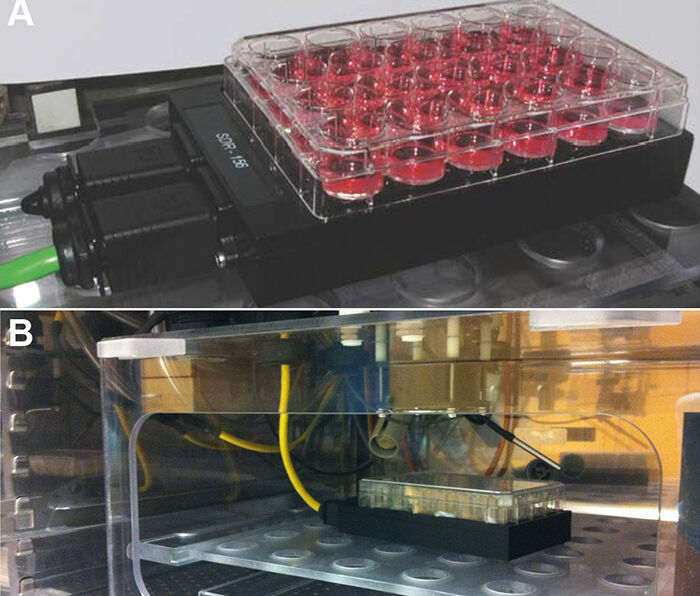
Energy catabolism in mammalian cells is primarily comprised of respiration (oxidative phosphorylation) and lactate fermentation. Typically, respiration is measured by O2 consumption and fermentation is measured by lactate production. Normal mammalian cells derive most of their energy through respiration (fermentation rarely provides a significant portion of the needed energy unless O2 is unavailable or pathological processes are in play). If energy derived through respiration is limited by hypoxia and / or pathology, fermentation will increase in attempts to compensate. Thus, it is important to be able to measure O2 consumption and lactate production when studying metabolic diseases. Mycoplasma of the Mollicutes class are considered the smallest self-replicating free-living prokaryotes [1]. In addition to mycoplasma infection being strongly linked to the hallmarks and characteristics of cancer [2, 3, 4, 5], their presence in a variety of human primary tumor samples [6, 7, 8] strengthens the possibility of a causative or at least a modulatory role in human carcinogenesis [9]. A link between cancer cell catabolism and infected cells would affirm this hypothesis. Therefore, we analyzed the energy catabolism of metastatic macrophage M3 cells, which were either infected or non-infected with M. arginini. We utilized two methods for measuring O2 consumption, the SDR SensorDish® Reader (PreSens; Fig. 1A) and the XF 96 Extracellular Flux Analyzer (Seahorse Bioscience). With the XF 96 Analyzer quantitative respiration measurements based on O2 consumption in small volumes can be performed. It features internal heaters for temperature stability, drug injection ports to monitor immediate effects, and it is capable of high through-put analyses. The SDR system can be used for continuous long-term measurements. With this reader dissolved O2 and pH can more easily be monitored at a set oxygen tension, and it has lower equipment and disposable costs. Furthermore, cells in suspension - including bacteria - can be monitored with the SDR. Although both systems can also measure pH as indirect indicator of lactate fermentation, direct enzymatic lactate measurements were instead utilized in this study.

Materials & Methods
The SDR SensorDish® Reader (PreSens) is a multi-channel system that allows parallel read-out of oxygen sensors integrated in each well of 6- or 24-well multidishes, so called OxoDishes® (PreSens). The reader is connected to a PC / notebook and the measurement interval is set with the SDR software. The XF 96 Analyzer (Seahorse Bioscience) isolates a small volume (< 7 µL) of media above the cells in a custom 96-well microplate (XF 96 Microplate, Seahorse Bioscience). Cellular O2 consumption causes changes in the dissolved O2 level in this transient micro-chamber which is measured every few seconds by solid state sensor probes residing 200 µm above the cells. For energy catabolism measurements with the SDR (Fig. 1B) DMEM high glucose + 10 % FBS was used. M. arginini were cultured alone to evaluate their O2 consumption relative to that of infected M3 cells. We used SP-4 media supplement plus 4mM arginine to gauge M. arginini O2 consumption. For mass spectrometry analysis and O2 measurements with the XF 96 Analyzer we used complete media (DMEM base + 10 mM glucose + 2 mM glutamine + Alubmax I).
Energy Catabolism of M3 Cells
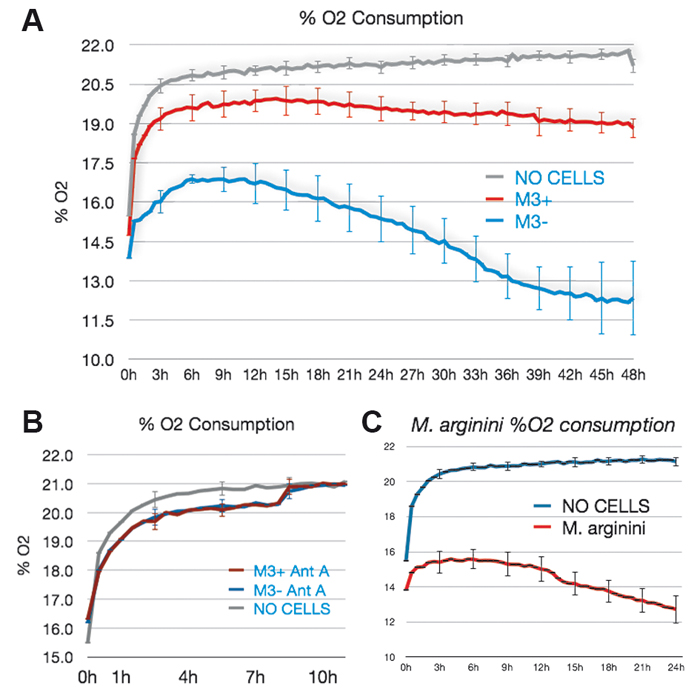
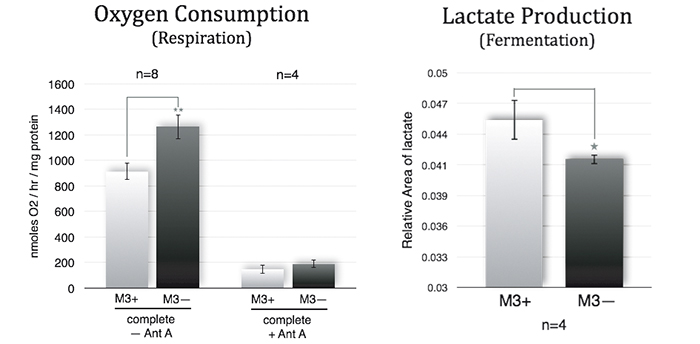
M3 cells infected with M. arginini (M3+ cells) were treated with antibiotic to eradicate the infection (M3- cells). Long-term measurements with the SDR over a 48 hour period showed that non-infected M3- cells consumed more oxygen than infected M3+ cells over the whole cultivation period. M3- cells had increased respiration and decreased fermentation activity (Fig. 3). This indicates that the bacteria may have had an effect on overall cellular catabolism. As expected M3+ and M3- cell respiration was largely sensitive to Antimycin A (a respiratory chain inhibitor) as can be seen in Figure 2B. M. arginini cultured alone consumes O2 (Fig. 2C), which needs to be considered relative to O2 consumption representing infected cell respiration. Although over a much shorter time period (2 h vs. 2 d), O2 consumption rate measurements of M3+ and M3- cells with the XF 96 Analyzer (Fig. 4) affirmed the SDR results. Again, M3- cells increased their respiration and decreased fermentation, and both M3+ and M3- cell respiration was sensitive to Antimycin A. Lactate production was measured by enzymatic assay and corrected to ATP level (Fig. 3) and by capillary electrophoresis mass spectrometry and corrected to cell number (Fig. 4). Results are in accordance with the oxygen measurement data.
Conclusion
Compared to metastatic macrophage cells infected with M. arginini non-infected cells show increased respiration and decreased fermentation activity indicating the bacteria may have an effect on overall cellular catabolism. While both measurement devices applied in this study utilize different measurement principles, we achieved similar results with the SDR and the XF 96 Analyzer when measuring the O2 consumption of infected and non-infected cells. Altogether, each of the two systems has its advantages, and both provided precise and continuous oxygen measurements contributing to our research findings.
References
[1] G. Rawadi, et al. (1995), PCR Methods Appl. 4, 199 - 208
[2] D. Hanahan, et al. (2001), Cell 144, 646 - 674
[3] G. Paton, et al. (1965), Nature 207, 43 - 45
[4] D. Y. Logunov, et al. (2008), Oncogene 27, 4521 - 4531
[5] S. Zhang, et al. (2004), Blood 104, 4252 - 4259
[6] S. Huang, et al. (2001), World J. Gastroenterol. 7, 266 - 269
[7] M. Pehlivan, et al. (2005), Urology 65, 411 - 414
[8] M. Kidder, et al. (1998), Gynecol. Oncol. 71, 254 - 257
[9] M. B. Rogers (2011), Oncotarget