

Watch tutorials, webinars and informative videos about PreSens optical sensor systems.
In situ Remediation of Contaminated Groundwater
VisiSens TD used to study release of groundwater remedial amendments from well screens under flow-through conditions
Seagren E.A., Waypa A.
Department of Civil, Environmental, and Geospatial Engineering, Michigan Technological University, USA
This application note shows how the VisiSens imaging technology can be used to visualize and quantify the release of groundwater remedial amendments from unpumped wells under flow-through conditions. In situ remediation of contaminated groundwater generally requires the contaminant to be brought into contact with a reactive material, or that necessary co-reactants are provided for the target abiotic or biotic reaction to proceed. Typically, in groundwater remediation, the required reactants may all be naturally present, but not in adequate quantities. E.g., in situ biodegradation of petroleum hydrocarbons may require the addition of oxygen. Such limiting reactants must be sufficiently supplied and brought into contact with the contaminant(s) of concern, and the microbes in the case of bioremediation.
The addition of remedial amendments and their subsurface mixing is one of the most difficult and expensive aspects of in situ remediation of groundwater. We focused on a semi-passive in situ remediation approach for the treatment of dissolved phase contamination using arrays of closely spaced unpumped remediation wells, or re-purposed monitoring wells, placed in the path of the contaminant plume, forming a discontinuous permeable wall. These wells can act as either an in situ reactor, or as a means to introduce amendments for stimulating biotic or abiotic degradation. The overall goal of this research was to investigate how to model the release into groundwater of amendments for stimulating in situ bioremediation that have been emplaced as a solid or slurry in such wells. Specifically, we experimentally evaluated a previously reported modeling approach for describing the passive release of amendments from well installations [1], which is based on borehole dilution theory [2]. The key parameter in borehole dilution theory is α, the ratio of the asymptotic width of the tracer cloud emanating from the unpumped remediation well to the inside diameter of the well screen, which is a result of the hydraulic conductivity contrast between the aquifer and well and bends the natural flow of groundwater toward the well.
Materials & Methods
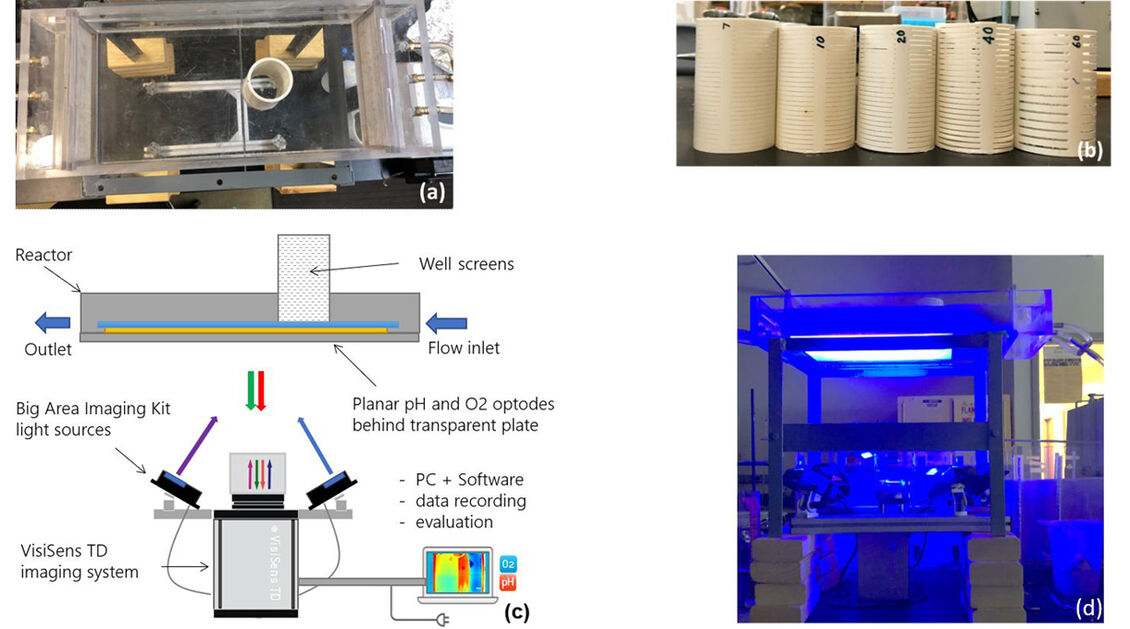
The experiments were performed in a 'box' reactor (Figure 1a), simulating a horizontal slice through an aquifer and a well screen. The polycarbonate reactor is 20 cm wide, 40 cm long, 5 cm deep. Screens at each end of the box distribute the horizontal flow of the aqueous phase through the system. Slotted PVC monitoring well screens (5.1 cm ID) were installed in the porous medium (Figure 1b). The porous medium in the tank represented a natural filter pack of 2-mm glass beads (Figure 2a). The simulated groundwater flow rate was set to achieve an average pore water velocity of approximately 10 m/d. For the pH adjustment experiments, a pellet of NaOH (~ 0.08 g) was placed in the center of the well screen, on the bottom of the reactor. For the oxygen addition experiments, a wire mesh tube (~ 25.4 mm ID) containing ~ 25 g of PermeOx® Ultra Granular (Evonik Active Oxygens, LLC) was inserted into the center of the well screen and held in place. To visualize the 2D distributions of pH and/or oxygen during the experiments with NaOH and PermeOx®, planar optrode foils (15 cm x 10 cm each; oxygen: SF-RPSu4, pH: SF-HP51R) were adhered to the bottom of the tank (Figure 1c, 1d). The measurements were conducted every 2-3 minutes, alternating between pH and oxygen images by using a VisiSens TD™ camera. The VisiSens TD was equipped with the Big Area Imaging Kit to increase the field of view up to 30 cm x 25 cm, thereby allowing the entire area of the tank bottom to be imaged.
Results
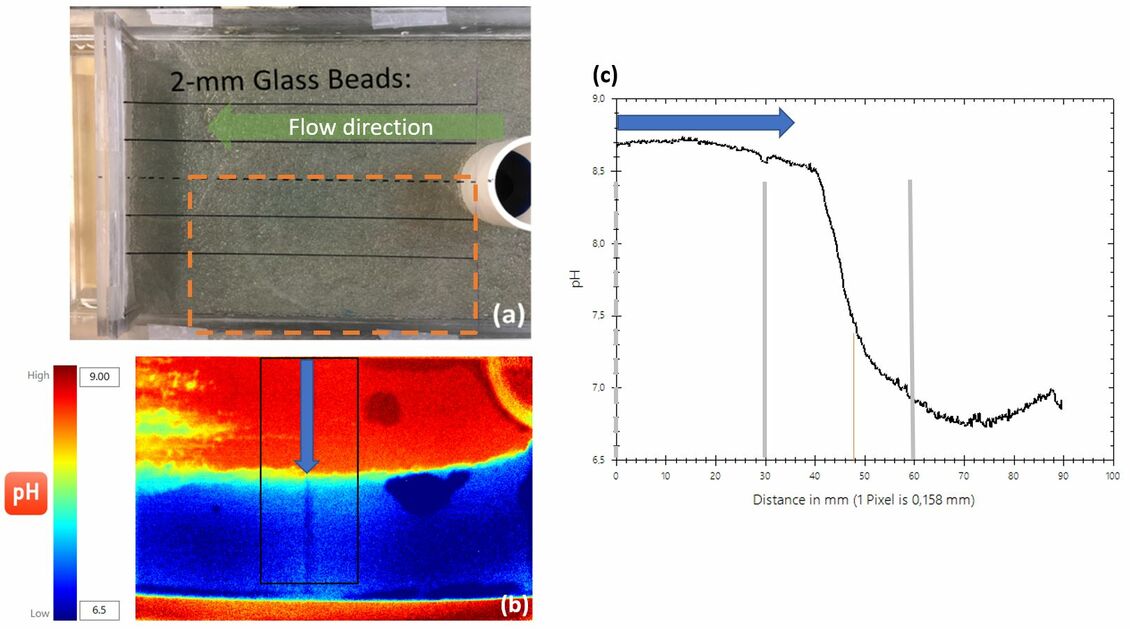
In the first reactive amendment experiment, NaOH was placed into a 1.5 mm (0.060 inch) slotted PVC well screen, with phosphate buffer as the aqueous phase. Oxygen optrodes were placed on one half of the box bottom, and pH optrodes were placed on the other half of the box bottom (Figure 2a, 3a). Over time, a plume of elevated pH developed that was similar in size and shape to that observed in a blue dye colorimetric reference experiment with the same well screen and porous medium. Based on the pH profile (Figure 2b), the estimated width of the plume with pH > 7.4 was approximately 9.27 cm, which corresponds to an α = 1.82 (Figure 2c). This is consistent with the blue dye plume results, which had a plume width of 8.89 cm, corresponding to an α = 1.75. A duplicate experiment resulted in almost identical results (plume width of 9.30 cm; α = 1.83). Thus, the α values with the strong base source, NaOH, are consistent with those obtained with the non-reactive blue tracer control experiment.
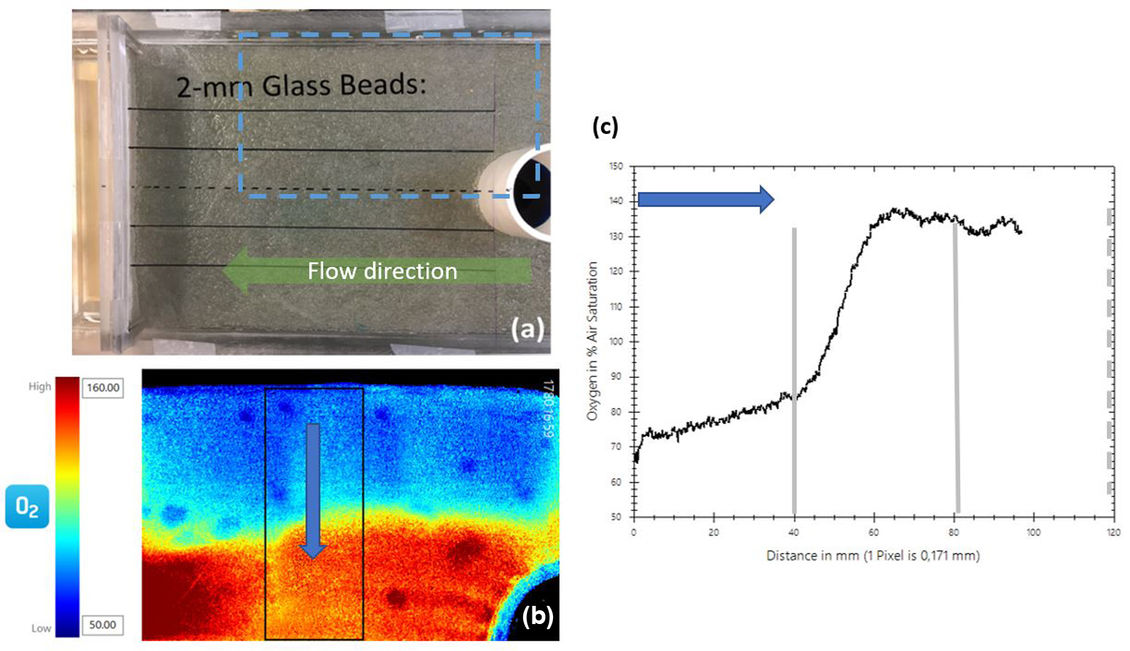
In the second experiment, PermeOx® was placed within the 1.5 mm slotted PVC well screen, with de-aerated phosphate buffer as the aqueous phase. Again, a plume developed that was similar in size and shape to the blue dye reference experiments (Figure 3b). However, based on the oxygen profile (Figure 3c), the estimated width of the oxygen plume was about 8.43 cm, or α = 1.66, which is narrower than the blue dye and NaOH plume results. This experiment was duplicated, with very similar results (O2 plume width of 7.62 cm; α = 1.5), again narrower than the blue dye and NaOH plume results for the same well screen and porous medium. Additional experiments with the blue-dye tracer indicated that neither the presence of the interior screen, or the PermeOx® material within the well screen contributed to a narrower plume. One other possible explanation for the narrower O2 plume width compared to the blue dye and NaOH plumes could be a slower oxygen release reaction, compared to the release reaction for the strong base NaOH.
Conclusion
The experimental results recorded with the VisiSens O2 and pH imaging system have proven that the borehole dilution theory predictions for the asymptotic width of the tracer cloud emanating from an unpumped remediation well without a filter pack are consistent. The one possible exception to this conclusion is for the case of remedial amendments that have a rate-limited release.
References
[1] Wilson, R.D., D.M. Mackay, and J.A. Cherry. 1997. Arrays of unpumped wells for plume migration control by semi-passive in situ remediation. Groundwater Monitoring & Remediation, 17(3):185-193.
[2] Drost, W., D. Klotz, A. Koch, H. Moser, F. Neumaier, and W. Rauert. 1968. Point dilution methods of investigating ground water flow by means of radioisotopes. Water Resources Research, 4(1):125-146.