

Watch tutorials, webinars and informative videos about PreSens optical sensor systems.
Oxygen Consumption Rates of Adherent MDCK II Monolayer Cells
A Comparison of Open and Closed Systems Using the VisiSens TD Imaging System
C. Schmittlein1, R. J. Meier2, J. Wegener1
1Institute of Analytical Chemistry, Chemo- and Biosensors, University of Regensburg, Regensburg, Germany
2PreSens Precision Sensing GmbH, Regensburg, Germany
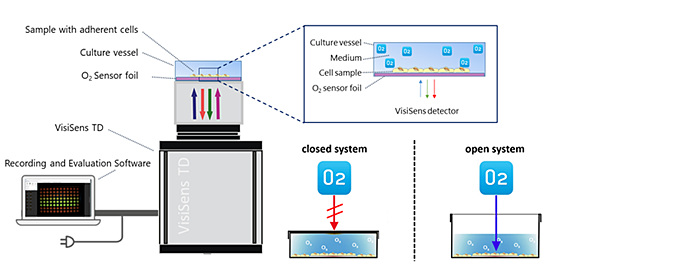
Oxygen is a molecule of utmost importance for biological systems because it is necessary for life but may also induce detrimental damage. Thus, the local O2 concentration is an important analytical parameter to describe the conditions and metabolic activity of biosystems. The oxygen consumption rate (OCR) of cells and tissues may be used e.g. as surrogate parameter for studying the effects of drugs. In this application note we show how optical O2 sensors and the VisiSens™ imaging system can be used to investigate OCR in open and closed vessels.
Materials & Methods
Measurements of cellular O2 consumption were performed with the VisiSens TD imaging system along with SF-RPSu4 oxygen sensors. Round pieces of the planar O2 sensitive sensor foils with 9.6 cm2 were glued onto the bottom of transparent plastic vessels. The optical isolation layer (OIW) was removed from the sensor foils for better cell adhesion. The sensor vessels were exposed to argon plasma for 1 min to clean and sterilize the surface prior to cell seeding. Two-point calibration of the O2 sensors was done with cell culture media with 0 % and 100 % air saturation. Calibration values were transformed from % air saturation to torr using the PreSens Oxygen Calculator. Automated time-series recording and evaluation of the images was done with the VisiSens ScientifiCal software. Cell number dependent O2 consumption of MDCK II cells was recorded in airtight (no O2 influx) vessels with 9.6 mL of L-15 medium. The vessels were sealed using a custom built airtight cover lid that was fixed with Blu-Tack®. To ensure that experimental readings of respiration are solely dependent on medium volume and not the presence of an air-liquid interface that enables additional diffusion of oxygen, vessels were fully filled with media and under exclusion of headspace. For comparison experiments, three cultivation chambers with different heights and therefore media volumes were compared to an open system with ambient air headspace. The volumes of the closed systems ranged from 4.8 to 19.2 mL, the open system contained a volume of 4.8 mL. Both, open and closed systems had an identical growth area of 9.6 cm2. MDCK II cells were seeded with a density of 4.5 x 10⁵ cells cm-2 24 hours before oxygen measurements were performed. Oxygen consumption was monitored in L-15 medium at 37 °C in an incubator under growth conditions. The apparent oxygen consumption rate (AOCR) for closed systems was determined by linear fitting of the pO2 decrease as a function of time.
y = A + Bx
where -B yields the AOCR. The oxygen consumption rate (OCR) for open systems was calculated with the following equation:
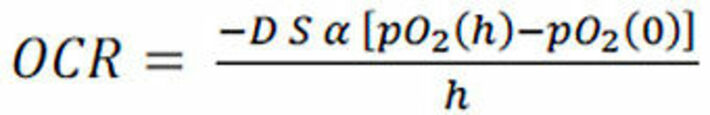
where D is the diffusion coefficient of O2 in water (3.3 10-5 cm2 s-1), S is the cell-covered area of the petri dish (9.6 cm2), α is the solubility coefficient at 37 °C (0.94 µmol cm-3 atm-1), h is the height of the medium column (0.5 cm), the pO2(h) is the oxygen partial pressure at the hight of the cell layer and pO2(0) is the oxygen partial pressure at the medium surface determined at t = 5 h.
Results
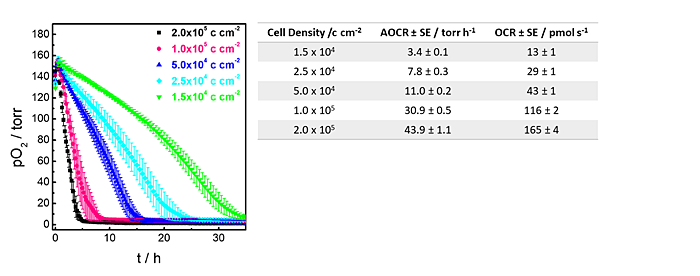
First, oxygen consumption profiles of the MDCK II kidney cell line were recorded depending on the cell inoculation density. MDCK II cells were seeded at five different cell densities on the oxygen sensor foils, ranging from confluent to highly sub-confluent cell layers. 24 h after cell inoculation, oxygen consumption of MDCK II cells was followed as a function of time in 9.6 mL of L-15 medium at initial 100 % air saturation in a closed system. Fig. 2 shows the decrease of the pO2 in the media in dependency on the initial cell seeding density (curves: mean and Stdev of three individual experiments). O2 in the media is consumed over time by the respiring cells. The two highest cell densities show merely linear decrease in O2. With lower initial cell density, the curve shape displays a more curved behavior due to cell division and a continuous increase of respiring cells on the sensor surface. Apparent oxygen consumption rates and corresponding oxygen consumption rates are summarized in Fig. 2.
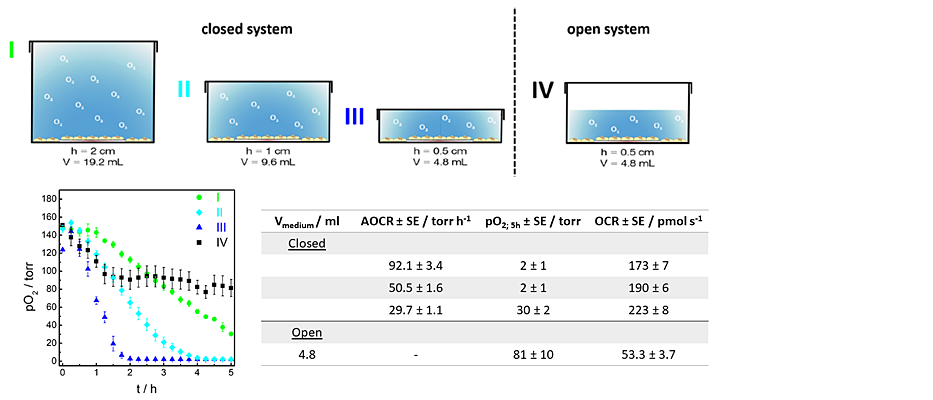
Furthermore, confluent MDCK II cells were cultivated in open or closed systems. As expected, pO2 below the epithelial layer decreased faster with a decreasing medium volume in closed systems. Oxygen depleted after t = 1.75 h when cells were cultivated in a closed system with a volume of 4.8 mL. If the volume was doubled to 9.6 mL, pO2 dropped within t = 3.75 h, and in 19.2 mL pO2 reached a value of (30 ± 2 torr) at the end of the 5 h observation time. In the open system pO2 first decreased linearly to (97 ± 11) torr, then reached stable values of about 80 torr which reflects an equilibrium state of O2 ingress and respiration. Fig. 3 shows the comparison of oxygen consumption rates in open and closed systems. The O2 profiles of closed systems were fitted and the apparent oxygen consumption rates (AOCRs) were determined.
Discussion & Conclusion
Both, open and closed OCR determination, have their strengths. Closed system determinations yields accurate and fast results. The set-up eases calculation of OCRs, as there is no need to account for O2 influx. OCRs can be directly determined by linear fitting the changes of pO2 over time, considering the used volume of the chamber. The volumes can be adapted to expected OCRs and feasible experimental time. When a cell monolayer is cultivated under static conditions in an open system, dissolved O2 reaches the adherent cells only by diffusion. The diffusion of O2 from the gas-medium interface to the cell layer is described by Fick's second law. Under the assumption that diffusion and respiration reach an equilibrium and the culture vessel is impermeable to O2, OCR can be calculated using equation 2. This method is technically straightforward and enables sequential addition of test compounds to be studied, but it is indeed slower.