VisiSens ScientifiCal Software Plugins - New Functions for Your Imaging Analysis
April 13, 2022These software extensions for the VisiSens ScientifiCal software and the VisiSens TD imaging system will assist you in processing your O2, pH and / or CO2 images and evaluating the data.
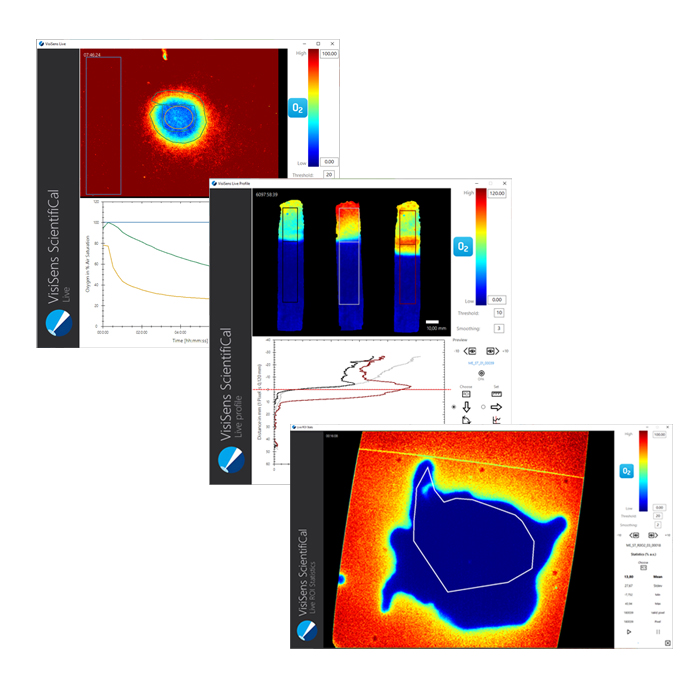
The plugins are small programs that enable easy access to data from previously recorded or live measurement images. With the Live Plot Plugin allows you to automatically plot the analyte data from up to 12 regions of interest over time. If you are researching geo-biological interfaces or want to follow gradient developments the Live Profile Plugin will help you analyzing the images. You can easily analyze and plot the profile along the areas you select. With the Live ROI Statistics Plugin you will get all information – mean analyte values, minimum and maximum as well as standard deviation and the number of pixels in your region of interest. This will help you to easily identify analyte changes or regions with good or insufficient supply in your samples. The Video Creator Plugin enables you to create video clips of your image data as .avi files, and you have the option to add additional information, like e.g. a scale bar, time stamp or pseudocolor analyte scale. Finally, with the RAW Extractor Plugin you can export your 2D analyte data into 16-bit pixel analyte maps. This makes the data accessible for use in 3rd party image analysis applications such as MATLAB or ImageJ.
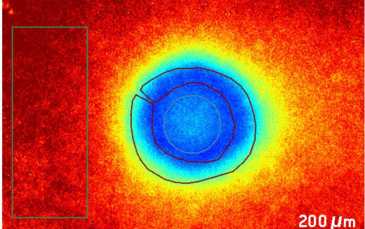
Use the VisiSens software extension to easily detect and identify analyte changes in your sample during the experiment. Visualize the O2, pH or CO2 distributions across your biological, environmental or geological samples, find regions with good or insufficient supply or hot spots of metabolic activities. With the VisiSens ScientifiCal Plugins your will get the most out of your imaging data!