Watch tutorials, webinars and informative videos about PreSens optical sensor systems.
Monitoring Spatio-Temporal Oxygen Consumption Within Live 3D Cancer Spheroids
VisiSens TD with MIC Kit Enables New Insights
Carina Schmittlein1, Robert Johannes Meier2, Christina Hupf1, Joachim Wegener1,3
1 Institute of Analytical Chemistry, Chemo- and Biosensors, University of Regensburg, Regensburg, Germany
2 PreSens Precision Sensing GmbH, Regensburg, Germany
3 Fraunhofer Research Institution for Microsystems and Solid State Technologies (EMFT),
Regensburg, Germany
Local oxygen gradients are present in all tissues, native or engineered. Tissue oxygenation influences cell migration, proliferation and differentiation. Hypoxic environments are necessary for certain developmental processes, e.g. embryonic and adult stem cells need specific oxygen tension to maintain their pluripotency, to differentiate, or to maintain their differentiation. However, hypoxic microenvironments are also a common characteristic for cancer tissue due to their upregulated metabolism. Multicellular tumor spheroids (MCTS) are considered a useful in vitro alternative to working with in vivo or ex vivo tumor material. They are a powerful tool to study effects of anticancer drugs as they represent an intermediate between 2D monolayer cells and regular tissue structures. Knowledge about the oxygenation status within spheroids and their different zones (proliferation zone, quiescence zone, necrotic zone), is of essential interest for tumor research. The lack of oxygen supply in central spheroid regions, e.g. can lead to quiescent or necrotic cores. The oxygenation status may serve as an indicator for the efficacy of anticancer drugs and can help to identify and choose suitable and personalized drugs. Information on time and spatially resolved oxygenation and hypoxia in live 3D cell cultures still lacks proper and biocompatible measurement techniques. Here we present a technique that allows for spatially and temporally resolved monitoring in 3D cell culture models under growth conditions over longer periods of time. It enables automated, non-invasive measurement inside a normal incubation system and provides 2D cross-sectional oxygen profiles.
Materials & Methods
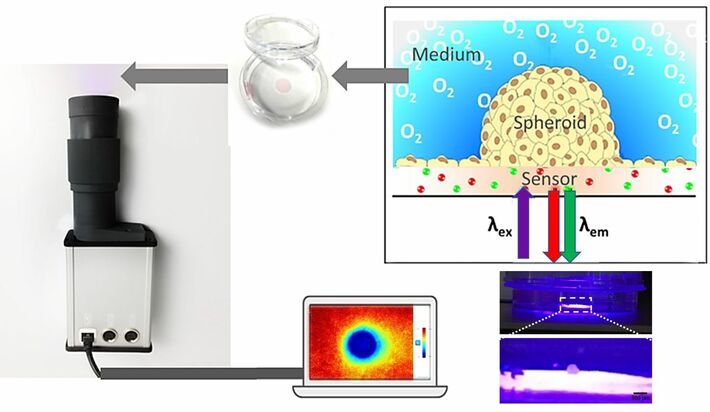
Spatio-temporal gradients were recorded using 2D oxygen imaging system VisiSens TD (PreSens, Regensburg, Germany) with a special microscopic imaging add-on consisting of a microscope lens and an adapted excitation light source (VisiSens TD MIC Kit). SF-RPSu4 oxygen sensor foils (PreSens, Regensburg, Germany) were used to quantify local O2 concentration. Single image 2D mapping or time series image acquisition, as well as image evaluation is conducted with the VisiSens ScientifiCal software. Sensors were calibrated using a two-point calibration with 0 % and 100 % air saturated media at 37 °C.
Pieces of the O2 sensor foil (growth area of 0.385 cm²) were glued to the bottom of a standard 3.5 cm diameter Petri dish with silicone glue (type SG-1). The white optical isolation layer was peeled off the sensor foils. Petri dishes with integrated sensors were treated with argon plasma for 1 min and the oxygen sensitive foil was coated with 150 µl fetal calf serum (FCS) to support cell adhesion. A round PDMS chamber with a diameter of 0.7 cm was placed around the sensing foil to simplify seeding of the spheroid and keeping it in place during attachment phase. 100 µl of MCF-7 medium containing a single 3D cultured spheroid (starting cell number 3000; approx. 500 µm diameter) was added on the oxygen sensor foil area. The surrounding area of the Petri dish was flooded with MCF-7 medium to prevent the samples from falling dry. Spheroids were allowed to attach to the surface of the oxygen sensitive substrates for 24 h (37° C, 5 % CO2).

Results
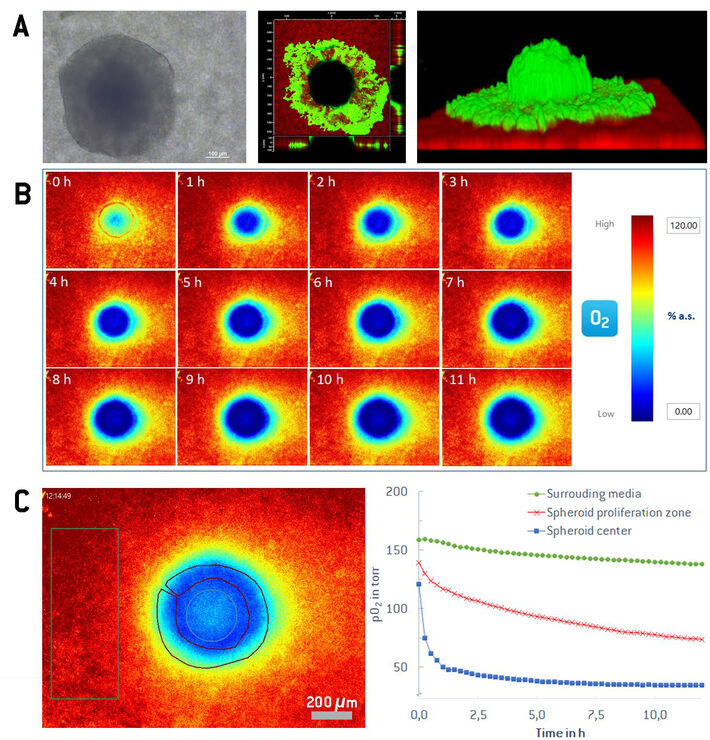
After seeding, the spheroid settles on the sensor foil, attaches, and builds a semi-spherical structure on the 2D sensor foil. The hemispherical shape and the attachment to the sensor foil is confirmed by confocal laser scanning microscopy after CaAM staining (see Figure 2A). The limited permeability and transparency of the 3D tissue impedes diffusion of the dye and the penetration of the excitation light into deeper parts of the spheroid. Thereby, CaAM displays bright green fluorescence in live cells of the outer spheroid region with a black region within the spheroid. Some cells from the original spheroid grow out and spread around the hemisphere. The red luminescence is emitted by the sensor foil. The hemispherical structure attached to the planar oxygen sensor foil enables recording of direct cross-sectional 2D oxygen maps from the contact zone between the spheroid and the sensor foil and visualizing any gradients within. The imaging system was focused on the sensor foil with the adhered spheroid. Images were automatically taken every 15 minutes over 12 h to demonstrate the possibility of long-time monitoring of the spheroid cross-section.

Figure 2B shows exemplary 2D oxygen maps displayed in pseudo color of a cross section of a MCF-7 spheroid along a 12 h time series under growth conditions. At 0h fresh medium was added to the petri dish causing a re-oxygenation. The inner core of the spheroid quickly turns hypoxic again within the first two hours, which is clearly visible to the naked eye from the purple and blue colors of the pseudo color scale. The oxygen gradient through the spheroid regions gets also clearly visible and obvious in the 2D oxygen map. Besides the visual pseudo color representation, the VisiSens evaluation program allows to freely select regions of interest (ROIs) for the different parts in an oxygen image, providing mean values with statistics in the selected areas. The oxygen concentration ranges from fully oxygenated medium (pO2 of 150 to 160 torr) surrounding the spheroid, to the steep gradient through the proliferation zone (100 to 50 torr) and a hypoxic quiescent zone in the spheroid center (down to 20 torr). Another strength of the image-based oxygen mapping is that the different ROIs can be investigated over time, resulting in insights over the temporal changes throughout the experiment. Figure 2C shows a comparison of the media, the proliferation zone and the spheroid hypoxic core over the time course of 12 hours.
Discussion & Conclusion
Chemical analysis of spheroids with usual staining methods, e.g. indicator dyes or nanoparticle sensors causes several severe problems. First, dyes or particle probes must reach all designated areas, which is impeded by diffusion limitations within the spheroid bulk, so that only the periphery of the 3D spheroid is stained and accessible. The limited staining of 3D tissue models is accompanied by the limited penetration depth of visible light in tissue not being able to reach inner parts of the spheroids, especially when working with bigger spheroids (>250 µm). Moreover, molecular oxygen indicators suffer from high photobleaching rates and severe phototoxicity through the generation of singlet oxygen, which makes time resolved oxygen monitoring impossible. Further, aggregation of dyes themselves or in certain niches changes the recorded signals independent from the oxygenation status and, thereby, causes erroneous results and impedes quantification. Sensor nanoparticles typically provide a shielded microenvironment reducing the release of singlet oxygen to a certain extent, but they alter the inner spheroid structure and integrity. These structural perturbations may modify the oxygen and nutrient transport within the spheroid by adding gas permeable and nutrient impermeable materials to the bulk.
The sensor foil and imaging based method overcomes these drawbacks and allows for direct imaging of temporal and spatial changes in oxygenation in a cross-section though the spheroid. The use of planar sensor foils and the VisiSens TD system with MIC configuration further enables long term monitoring during spheroid culture under growth conditions. This enables performing studies in tissue engineering, drug tests, screening or cancer research.


